Volume 27, Issue 1, February 2007, Pages 92-98
Roman
Tomaschitz ,
a,
,
a,

Abstract
A tachyonic spectral fit to the pulsed γ-ray flux of the Crab is performed, based on the superluminal spectral densities generated by ultra-relativistic electrons. The γ-ray wideband of the pulsar can be reproduced by a tachyonic cascade spectrum, capable of generating the spectral curvature in double-logarithmic plots as well as the extended spectral plateau defined by COMPTEL and EGRET flux points in the MeV band. Estimates on the magnetospheric electron population generating the radiation are inferred from the spectral fit, such as power-law indices, electron temperature and the electronic source count.
Keywords: Superluminal cascade spectra; Tachyonic γ-rays; Longitudinal polarization; PSR B0531+21
PACS classification codes: 95.30.Gv; 11.10.Lm; 97.60.Gb; 98.70.Sa
Article Outline
1. Introduction
The goal is to point out evidence for the γ-ray spectrum of the Crab pulsar to be tachyonic. The most pronounced difference between electromagnetic and tachyonic radiation lies in the emission process. Due to the negative mass-square of the radiation field, there is a residual radiation that persists in the limit of large orbital bending radius, so that freely moving electrons can radiate superluminal quanta. Radiation densities attached to uniformly moving charges have no analog in electrodynamics, their very existence has substantial implications for the spacetime structure, requiring an absorber medium [1], [2] and [3]. The Green function of the superluminal radiation process is time-symmetric, there is no retarded propagator supported outside the lightcone. The advanced modes of the radiation field are converted into retarded ones by virtue of a nonlocal, instantaneous interaction with the absorber. The latter defines a universal frame of reference, necessary to render the superluminal signal transfer causal. The time symmetry of the Green function implies that there is no radiation damping, the radiating charge stays in uniform motion, the energy radiated is supplied by the oscillators constituting the absorber medium. The superluminal spectral densities depend on the velocity of the charge in the rest frame of the absorber. I also mention that tachyons and photons couple only indirectly via matter fields, there is no absorption of high-energy tachyons by the infrared background. At γ-ray energies, the speed of tachyons is very close to the speed of light, the noticeable difference to electromagnetic radiation is the longitudinally polarized flux component. The polarization of tachyons can be determined from transversal and longitudinal ionization cross-sections, which peak at different scattering angles.
These features of tachyonic wave propagation have been elaborated in previous papers, here we focus on a specific example, a tachyonic spectral fit to the pulsed γ-ray flux of the Crab. When tachyonic spectral densities are averaged with thermal or power-law electron densities, this leads to cascade spectra, extended spectral plateaus followed by power-law decay terminating in exponential decay. A glance at the γ-ray broadband of the Crab pulsar suggests that it can readily be fitted by a cascade spectrum, cf. the figures in Section 3.
In Section 2, we explain the transversal and longitudinal spectral densities of uniformly moving charges, as well as their averaging with thermal and exponentially cut power-law electron distributions. The spectral averaging can be done in closed form, and high- and low-temperature expansions of the tachyonic spectral densities are derived. The spectral breaks and slopes of tachyonic cascade spectra are discussed. In Section 3, we perform the spectral fit to the pulsed Crab γ-wideband, infer the cutoff temperature of the electronic/protonic source populations, and compare it to the break energies in the cosmic-ray spectrum. In Section 4, we present our conclusions.
2. Superluminal spectral densities and spectral averages
The transversal and longitudinal tachyonic radiation densities
of a uniformly moving electron read [3]
 = c = 1
can easily be restored. We use the Heaviside–Lorentz system, so that αq = q2/(4π
 c) ≈ 1.0 × 10⁻¹³.
The tachyon mass is mt ≈ 2.15 keV/c2,
the tachyon–electron mass ratio mt/m ≈ 1/238.
These estimates are obtained from hydrogenic Lamb shifts [4]. The
tachyonic count rates (tachyons emitted per unit time and unit
frequency interval) are nT,L(ω)
  pT,L(ω)/ω.
The radiation densities (1) refer to a
single charge with Lorentz factor γ. We average
them with electron distributions, power-laws exponentially cut with
Boltzmann densities, dρ ∝ E−2−αe−E/(kT)d3p,
or
 mc2/(kT).
At α = −2, the distribution is
thermal. The electronic Lorentz factors range in an interval γ1
  γ < ∞.
The normalization factors Aα,β(γ1,
n1) of densities (2) are
determined by
 The averaging is carried out via
where
The spectral range of the radiation densities (1) is
0 < ω < ωmax(γ).
Inversely, the condition ![]() or
or ![]() defines the minimal electronic Lorentz factor for radiation at this
frequency. (
defines the minimal electronic Lorentz factor for radiation at this
frequency. (![]() stands for the rescaled frequency ω/mt.)
That is, an electron in uniform motion can radiate at ω
only if its Lorentz factor exceeds
stands for the rescaled frequency ω/mt.)
That is, an electron in uniform motion can radiate at ω
only if its Lorentz factor exceeds ![]() .
The lower edge of Lorentz factors in the electronic source distribution
defines the break frequency, ω1
.
The lower edge of Lorentz factors in the electronic source distribution
defines the break frequency, ω1  ωmax(γ1),
or
 ![]() ,
which separates the spectrum into a low- and high-frequency band. We
have
,
which separates the spectrum into a low- and high-frequency band. We
have ![]() ,
and
,
and ![]() if ω > ω1.
The averaged energy density (3) can thus be
assembled as
if ω > ω1.
The averaged energy density (3) can thus be
assembled as
 pT+L
pT+L  α, β
for the unpolarized density.
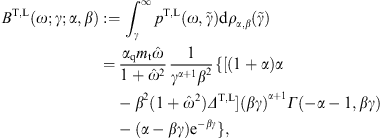
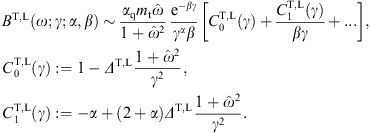
To obtain the low-temperature expansion, β  1, of the spectral average (5), we
substitute the asymptotic expansion of the incomplete Γ-function
[5] into the
spectral function BT,L(ω;γ;α,β),
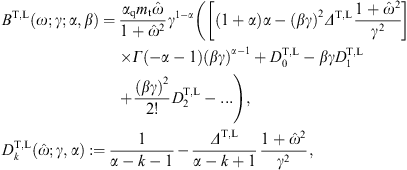
 1. The high-temperature expansion, β
  1,
of BT,L in (4) is based on
the ascending series of Γ(−α − 1, βγ),
1,
of BT,L in (4) is based on
the ascending series of Γ(−α − 1, βγ),which requires βγ
 1.
In the opposite limit, βγ
  1, we may still use the low-temperature
expansion (6), even if β
  1.
Singularities occurring at integer α in (7) cancel if ε-expanded.
If γ1 = 1,
β  1
and α > 1, the maximum of
  pT,L(ω;
γ1, n1)
 α, β,
cf. (5), is
determined by the lead factor
 ![]() in the high-temperature expansion (7). This peak
is located at
in the high-temperature expansion (7). This peak
is located at ![]() and is followed by power-law decay ∝ω−α
for ω
and is followed by power-law decay ∝ω−α
for ω  mt/β
and exponential decay starting at about ω ≈
mt/β. The
low-temperature expansion (6) applies for ω
mt/β
and exponential decay starting at about ω ≈
mt/β. The
low-temperature expansion (6) applies for ω  mt/β.
If γ1
  1 (but still βγ1
  1
and α > 1), the peak of
  pT,L(ω;γ1, n1)
 α, β
is determined by the factor
 ![]() in (7) and occurs
at ωmax ≈ mt.
It is followed by a broken power-law, at first
in (7) and occurs
at ωmax ≈ mt.
It is followed by a broken power-law, at first  pT,L
pT,L α, β ∝ 1/ω,
in the range 1
  ω/mt
ω/mt  γ1,
and then
  pT,L
pT,L α, β ∝ ω−α
in the interval γ1
  ω/mt
ω/mt  1/β.
At ω ≈ mt/β,
there is an exponential cutoff according to (6).
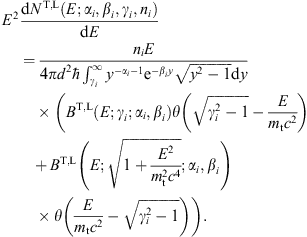
The spectral fit is performed with the E2-rescaled
flux density E2dNT,L/dE,
which relates to the energy density  pT,L
pT,L α, β
in (5) as
 pT,L
pT,L α, β
give a plateau value E2dNT,L/dE ∝ 1
in the range 1
  E/(mt
c2)
  γ1,
followed by power-law decay E2dNT,L/dE ∝ E1−α
in the band γ1
  E/(mt
c2)
  1/β,
and subsequent exponential decay.
In the foregoing discussion of the high-temperature
asymptotics, we assumed an electron index α > 1.
We still have to settle the case α < 1.
The spectral peak at ωmax ≈ mt
is again determined by the factor ![]() .
Adjacent is a power-law slope
.
Adjacent is a power-law slope  pT,L
pT,L α,β ∝ 1/ω
in the range 1
  ω/mt
ω/mt  1/β, so that E2dNT,L/dE ∝ 1.
At ω ≈ mt/β,
there is the cross-over to exponential decay, cf. (6). This holds
true for γ1 = 1
as well as γ1
  1, provided βγ1
  1,
since the leading order of the high-temperature expansion (7) does not
depend on γ for α < 1.
If βγ1
  1 despite of β
being small, then the low-temperature expansion (6) applies
instead of (7).
3. Tachyonic cascade spectra and spectral fits
Fig. 1, Fig. 2 and Fig. 3 show the E2-scaled
differential number flux, E2dNT+L/dE,
as defined in (8), fitted to
the data points. As the polarization is not observed, we add the
transversal and longitudinal densities, writing  pT+L
pT+L

 pT
pT +
+  pL
pL for
the energy density and dNT+L
  dNT + dNL
for the number flux. We restore the natural units on the right-hand
side of (8), up to now
we have used
  = c = 1,
and write E(1) for
  ω(1).
The spectral maps are in MeV units, with the differential tachyon flux dNT,L/dE
in units of MeV−1s−1cm−2.
The normalization factor in (5) is
dimensionless,
 ![]() ,
where n1 is the number of
radiating electrons with Lorentz factors exceeding γ1,
distributed according to density (2). α
is the electronic power-law index, and β the
exponential cutoff in the electron spectrum, both to be determined from
the spectral fit like n1 and
γ1. As for the electron count
n1, it is convenient to use a
rescaled parameter
,
where n1 is the number of
radiating electrons with Lorentz factors exceeding γ1,
distributed according to density (2). α
is the electronic power-law index, and β the
exponential cutoff in the electron spectrum, both to be determined from
the spectral fit like n1 and
γ1. As for the electron count
n1, it is convenient to use a
rescaled parameter ![]() for the fit,
for the fit,
 [keV
s] implies the tachyon mass in keV units, that is, we put mtc2 ≈ 2.15
in the spectral function (4). The purpose
of this rescaling is to avoid the distance estimate in the actual
fitting procedure. Once
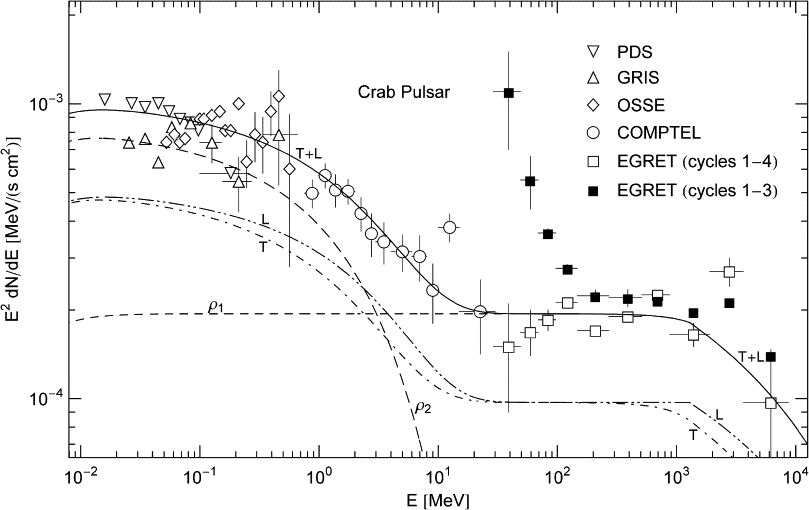
Fig. 1. Tachyonic spectral map of the Crab pulsar.
PDS, COMPTEL and EGRET (open squares) data points from [7], GRIS points
from [8], OSSE points
from [9]; also see [10], [11] and [12] for COMPTEL
data on the pulsed Crab emission. The open squares are the final EGRET
data covering cycles 1–4, corrected for spark chamber gas aging [13]. For
comparison, we also indicate the EGRET flux points based on cycles 1–3,
cf. [14]; the error
bars on the last four flux points are suppressed, they are similar to
those on the open squares with the same abscissa. In the χ2-fit,
only the final EGRET data (open squares) are considered, and the
vertical error bar on the second flux point is assumed to hold for the
subsequent six points as well. The solid line T + L
is the unpolarized differential tachyon flux dNT+L/dE,
rescaled with E2 for better
visibility, cf. (12). The total
flux T + L can be split into transversal (T,
dot–dashed) and longitudinal (L, dot–dot–dashed) flux components dNT,L/dE,
cf. (13). The
cascade spectra labeled ρ1,2
(dashed) are the unpolarized flux densities dNT+L(E,ρi)/dE
of two electron populations ρi=1,2,
cf. Table 1 and (14). These
cascades add up to the total flux T + L, which is the
actual spectral fit with parameters (of the electron densities ρi=1,2)
listed in Table 1. The MeV
plateau terminates in a nearly straight GeV power-law slope. In
contrast to the ρ2-cascade,
the cutoff temperature of ρ1
is too high to significantly curve the power-law slope in the energy
range covered here, cf. Fig. 3 for the
wideband view. A spectral break at E ≈ mtγ1 ≈ 1.3 GeV
is visible as edge in the longitudinal spectral map, cf. after (8). ρ1
is the cascade producing the MeV plateau and the adjacent GeV power-law
slope ∝1/E (α = 1,
cf. Table 1). The
soft γ-ray band is
generated by adding the flux of the ρ2-cascade
to the ρ1-plateau. The
spectral curvature is caused by the Boltzmann factor in the averaged
spectral densities, whose cutoff frequency is Ecut = (mt/m)kT,
defined by ![]() according to the low-temperature/high-frequency expansion (6). This
implies cutoffs at 88 GeV for the ρ1-cascade
and 6.3 MeV for ρ2.
The cutoff temperature of the respective electron densities is recorded
in Table 1. This
figure is a close-up of the γ-wideband in Fig. 3.
according to the low-temperature/high-frequency expansion (6). This
implies cutoffs at 88 GeV for the ρ1-cascade
and 6.3 MeV for ρ2.
The cutoff temperature of the respective electron densities is recorded
in Table 1. This
figure is a close-up of the γ-wideband in Fig. 3.
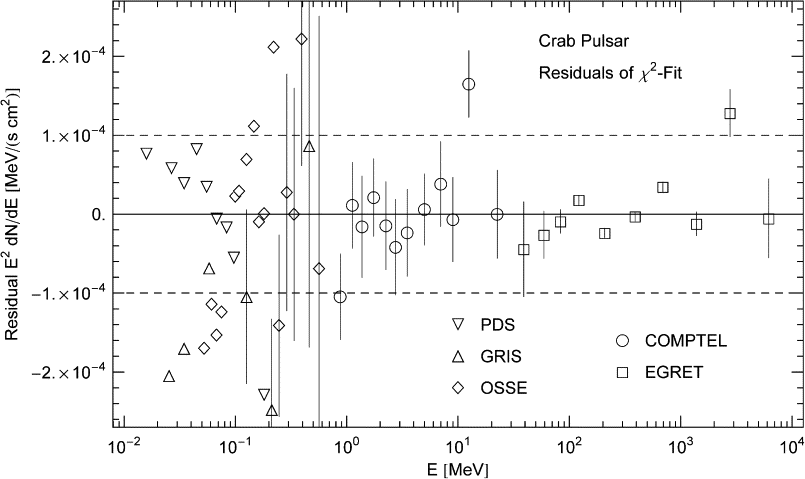
Fig. 2. Residuals of the least-squares fit in Fig. 1. The cascade ρ1 in Fig. 1 is based on ten EGRET flux points; the ninth point above the 10−4-mark is discounted in the χ2-fit. This cascade is fitted with χ2 ≈ 3.85 (unreduced) and a confidence level of 57% with 5 dof. The cascade depends nonlinearly on the four fitting parameters, which limits the significance of Gaussian p-values, Γ(dof/2,χ2/2)/Γ( dof/2), apart from the low statistics. For instance, the first seven points of the EGRET plateau amount to a horizontal straight-line fit effectively depending on only one independent fitting parameter, which suggests a much higher confidence level. The ρ2-cascade in Fig. 1 on top of ρ1 is based on the COMPTEL points. The first and last of the indicated 12 COMPTEL points are discarded in the fit, and χ2 is weighted with the indicated error bars. We find χ2 ≈ 1.40 and a confidence level of 97% with 6 dof. This high p-value is mainly due to the larger error bars, as compared to the EGRET fit. The PDS, GRIS and OSSE points are not included in the χ2-fit of the ρ2-cascade, but it is evident from the rather symmetrically spaced residuals that the cascade is a good fit to these dispersed data sets. The residuals (data points minus fitting function (12), (13), (14) and (15) with parameters as in Table 1) have not been normalized.
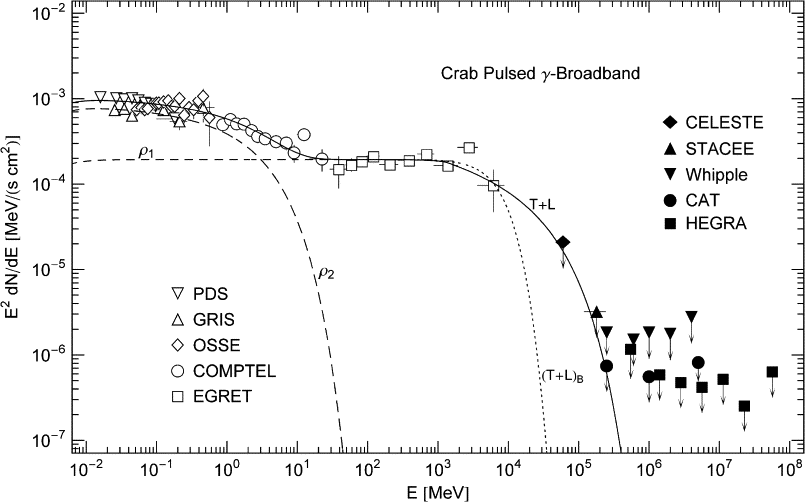
Fig. 3. γ-Ray wideband of the Crab pulsar. Data
points depicted as open symbols are referenced in Fig. 1. Filled
symbols (upper bounds) from CELESTE [15], STACEE [16], Whipple [17], CAT [18], and HEGRA [19]. The
spectral fit T + L (solid line) is done with the
rescaled unpolarized tachyon flux E2dNT+L/dE
as in Fig. 1. The GeV
power-law slope following the spectral break at 1.3 GeV terminates in
exponential decay. The GeV-fit hinges on the last EGRET point, the
CELESTE and STACEE points, and the first CAT point. The latter three
data points are upper limits. Another option for the high-energy fit is
the dotted extension (T + L)B
of the MeV plateau, fitted to the EGRET points only, the upper bounds
are evidently satisfied. This fit is based on a thermal Boltzmann
distribution generating the ρ1-cascade,
the parameters of the electron density ρ1
in Table 1 are
replaced by α = −2, β ≈ 7.17 × 10⁻⁷
and γ = 1, and ![]() remains unchanged. In this case, there is no power-law interface
between the MeV plateau and exponential decay. Presently, there are not
enough data points in the GeV band to discriminate between the
exponentially cut power-law fit T + L and the thermal
fit (T + L)B.
remains unchanged. In this case, there is no power-law interface
between the MeV plateau and exponential decay. Presently, there are not
enough data points in the GeV band to discriminate between the
exponentially cut power-law fit T + L and the thermal
fit (T + L)B.
Electronic source densities ρi generating the tachyonic cascade spectra of the Crab pulsar
Each distribution is defined by parameters ![]() ,
cf. Eq. (2). α
is the electronic power-law index, β the cutoff
parameter in the Boltzmann factor, and γ the lower
edge of Lorentz factors in the source population.
,
cf. Eq. (2). α
is the electronic power-law index, β the cutoff
parameter in the Boltzmann factor, and γ the lower
edge of Lorentz factors in the source population. ![]() is the amplitude of the tachyonic flux density generated by ρi.
The electron count ne is
inferred from
is the amplitude of the tachyonic flux density generated by ρi.
The electron count ne is
inferred from ![]() via (9) and d ≈ 2 kpc.
kT is the electron temperature. The ρ1,2-cascades
in Fig. 1 and Fig. 3 are
obtained by averaging the superluminal radiation densities (1) with the
electron distributions ρ1,2
listed here. The parameters
via (9) and d ≈ 2 kpc.
kT is the electron temperature. The ρ1,2-cascades
in Fig. 1 and Fig. 3 are
obtained by averaging the superluminal radiation densities (1) with the
electron distributions ρ1,2
listed here. The parameters ![]() are extracted from the spectral fit.
are extracted from the spectral fit.
In the case of a thermal electron distribution (α = −2),
we may identify kT
[TeV] ≈ 5.11 × 10⁻⁷/β.
We use this definition of electron temperature also for other electron
indices α. kT is the energy at
which the exponential decay of the electron density (2) sets in. At
high temperature, density (2) is peaked at
γpeak ≈ −α/β,
provided α < 0 and β 
 α
α ; the peak is
followed by exponential decay. If α > 0,
the electron density is decreasing monotonically, at first as power-law
and exponentially beyond kT. Nearly straight
power-law slopes, as seen in the low GeV range of Fig. 1, can only
emerge for electron indices α > 1,
cf. after (7). The
spectral break from the MeV plateau into the power-law slope is
determined by the lower edge γ1
of electronic Lorentz factors, cf. after (4). If α < 1,
the MeV plateau is followed by exponential decay, without power-law
cross-over, as exemplified by the thermal cascade
(T + L)B in Fig. 3.
Wideband cascade spectra are obtained by averaging over
multiple electron populations,
where ni is the electron count and γi the smallest Lorentz factor in the population defined by dραi,βi. The electron numbers ni (attached to a power-law index αi, temperature βi = mc2/(kTi), and interval boundary γi) determine the weights in the linear combination (10).
We summarize the flux density plotted in Fig. 1 and Fig. 3. The
spectral fit is done for unpolarized radiation, so that we start by
summing over the polarization components,
The individual cascades used in the least-squares fit described in the caption of Fig. 2 are assembled from (2), (4), (5) and (8). Restoring dimensions, we find their explicit shape as
Each cascade depends on four fitting parameters, αi, βi, γi, ni, whose meaning is explained at the beginning of this section. [The actual spectral fit described in the figure captions is done by at first summing over the polarizations in (14) and by adding the χ2-fits of the unpolarized cascades E2dNT+L(E;αi, βi, γi, ni)/dE. That is, we interchange the summations in (12) and (13) to obtain E2dN/dE.] θ is the Heaviside step function, and we use the shortcut
where we put ΔT = 1 and ΔL = 0, for transversal and longitudinal polarization, respectively.
The total tachyonic flux density E2dN/dE
is plotted in Fig. 1 and Fig. 3 (solid
line T + L). The individual unpolarized cascades, E2dNT+L(E;αi,
βi, γi,
ni)/dE,
obtained by summing over the polarizations in (14), are
labeled ρi=1,2
(dashed curves). They add up to the total tachyonic flux density
labeled T + L. The electron densities ρi
in Table 1 produce
the cascade spectra ρi
and are in turn defined by parameters ![]() obtained from the least-squares fit.
obtained from the least-squares fit.
The cutoff kT in the electron energy is listed in Table 1, for each electron population generating a cascade in the γ-ray wideband. In the case of protonic source particles, the cutoff energies have to be multiplied with 1.8 × 10³, the proton/electron mass ratio. These cutoffs are to be compared to two spectral breaks in the cosmic-ray spectrum, occurring at 103.5 TeV and 105.8 TeV, dubbed knee and second knee, respectively [23]. A protonic source density generating the ρ1-cascade has a cutoff at about 104.6 TeV, suggesting protons in the pulsar magnetosphere with energies between the first and second knee.
4. Conclusion
We have considered superluminal spectral densities generated by freely moving electrons, discussed the spectral averaging with electronic source distributions, and derived the high- and low-temperature expansions of the averaged radiation densities. We demonstrated that the γ-ray flux of the Crab pulsar can be reproduced by tachyonic cascade spectra, and explained the spectral plateau, the power-law slopes, and the spectral curvature.
Here, we have studied superluminal radiation from electrons in uniform motion. Tachyonic synchrotron and cyclotron radiation was investigated in [24] and [25]. In the zero magnetic field limit, the tachyonic synchrotron densities converge to the spectral densities (1) for uniform motion. Electromagnetic synchrotron radiation vanishes in this limit, of course. A finite bending radius induces modulations in the spectral densities. These oscillations are quite small, just tiny ripples along the spectral slope with increasing amplitude toward the spectral break [25]. If integrated over a thermal or power-law electron distribution as done here, these oscillations are averaged out.
Several electromagnetic radiation mechanisms have been invoked to model the spectra of γ-ray pulsars, most notably curvature radiation due to electric fields followed by pair creation, accompanied by synchrotron radiation and inverse Compton scattering [26]. These mechanisms are quite interlocked, cf. the flow-chart in [27], and subject to frequent revisions [28] and [29]. An electromagnetic spectral fit to the pulsed Crab emission, directly comparable to Fig. 1, can be found in Fig. 11 of [28].
In Section 3, we pointed out that only a fraction αq/αe ≈ 1.4 × 10⁻¹¹ of the tachyon flux arriving at the detector is actually absorbed, so that the measured flux has to be rescaled with the ratio of electric and tachyonic fine structure constant. This rescaling applies to γ-ray spectra only, to frequencies much higher than the 2 keV tachyon mass, so that the mass-square can be dropped in the tachyonic dispersion relation. At X-ray energies, we have to rescale with the respective cross-section ratio, σe(ω)/σq(ω), where σe is the electromagnetic cross-section and σq its tachyonic counterpart. The detection mechanism for hard and high-energy X-rays is usually ionization, generating scintillations in NaI(Tl) and CsI(Na) crystals of phoswich detectors [30], or gas scintillations by ionization of Xenon atoms in proportional counters [31]. Tachyonic ionization cross-sections of hydrogen-like ground states, that can be used for X- as well as γ-rays, have been calculated in [32]. At γ-ray energies, photonic and tachyonic dispersion relation coincide, and the cross-section ratio of the detection mechanism (such as ionization [33], Compton scattering [34] and pair production [35], the latter two quantified by Klein-Nishina and Bethe–Heitler cross-section) approaches a constant limit value αe/αq, which amounts to an overall rescaling of the tachyonic flux amplitude. By contrast, at X-ray energies, we would have to rescale the tachyonic flux density with the energy dependent cross-section ratio, which affects the shape of the spectral map. If a grating spectrometer is used, the interference peaks are determined by wavelength. In this case, the observational plots have to be reparametrized by wavelength, and then the tachyonic dispersion relation is substituted to obtain the actual energy-flux relation.
Acknowledgement
The author acknowledges the support of the Japan Society for the Promotion of Science. The hospitality and stimulating atmosphere of the Centre for Nonlinear Dynamics, Bharathidasan University, Trichy, and the Institute of Mathematical Sciences, Chennai, are likewise gratefully acknowledged.


