Volume 385, Issue 2, 15 November 2007, Pages 558-572
Roman
Tomaschitz ,
a,
,
a,

Abstract
Tachyonic spectral densities of ultra-relativistic electron populations are fitted to the γ-ray spectra of two microquasars, LS 5039 and LSI +61°303. The superluminal spectral maps are obtained from BATSE, COMPTEL, EGRET, HESS, and MAGIC data sets. The spectral averaging is done with exponentially cut power-law densities. Estimates of the electron distributions generating the tachyon flux are obtained from the spectral fits, such as power-law indices, electron temperature and source counts. The internal energy and heat capacities of the source populations are calculated. An extensive entropy functional is defined for Boltzmann power-law densities and its stability is checked. The high-temperature limit of the thermodynamic variables is determined by the power-law index of the electron plasma, which enters in the scaling exponents as well as the amplitudes.
Keywords: Superluminal radiation; Tachyonic γ-rays; Boltzmann power-law ensembles; Spectral averaging; γ-Ray binaries
PACS classification codes: 05.70.Ce; 05.20.Gg; 52.25.Kn; 95.30.Tg
Article Outline
- 1. Introduction
- 2. Tachyonic γ-ray spectra of microquasars
- 3. Caloric equation of state and heat capacities of electronic power-law distributions
- 4. Ultra-relativistic Boltzmann power laws
- 5. Conclusion
- Acknowledgements
- Appendix A. High-temperature asymptotics of Gibbs free energy and entropy
- References
1. Introduction
We study the tachyonic spectral maps of two microquasars, LS 5039, cf. Refs. [1] and [2], and LSI +61°303, cf. Refs. [3] and [4], and reconstruct the electron distributions emitting the superluminal radiation. The spectral maps of these γ-ray binaries suggest cascade spectra which are generated by electronic power-law densities exponentially cut with the Boltzmann factor. Classical statistics applies, as the high-temperature regime is invoked at γ-ray energies. We average the tachyonic spectral densities with electronic power-law distributions, and infer the power-law index, the electron count, and the temperature from the spectral fits. Based on these parameters, we calculate the internal energy and the specific heat of the ultra-relativistic electron plasma of the microquasars. To this end, we set up the thermodynamic formalism for Boltzmann power-law ensembles. Starting with the grand partition function, we find an entropy functional for exponentially cut power-law densities that is extensive and stable. We derive the Helmholtz and Gibbs free energies as well as the low- and high-temperature expansions of the caloric equation of state and the heat capacities, in particular their high-temperature scaling depending on the electronic power-law index.In Section 2, we briefly sketch the transversal and longitudinal tachyonic spectral densities and their averaging with Boltzmann power laws, which results in cascade spectra. We perform the spectral fits to the γ-ray wideband of the microquasars, and extract the parameters of the electronic source populations, such as power-law index, temperature and source number. In Section 3, we develop the thermodynamic formalism for exponentially cut power-law densities and derive the low- and high-temperature expansions of the thermodynamic variables, focusing on entropy, equations of state, and the specific heats. In Section 4, we investigate ultra-relativistic Boltzmann ensembles, power-law densities with Lorentz factors exceeding a high-energy threshold, and we calculate the internal energy and heat capacities of the electron gas in the two microquasars. In Section 5, we present our conclusions. In Appendix A, we list the asymptotic expansions of the partition function, entropy, and the free energies at integer electronic spectral index, which requires special treatment due to logarithmic temperature dependence in the high-temperature regime.
2. Tachyonic γ-ray spectra of microquasars
The tachyonic radiation densities of uniformly moving
electrons were derived in Ref. [5],
 c)≈1.0×10⁻¹³.
The tachyon mass is
 The radiation densities (2.1) refer to a
single charge with Lorentz factor γ. We average
them with ultra-relativistic electron distributions, power-law
densities exponentially cut with the Boltzmann factor:
 γ<∞.
The normalization
  1
the lower edge of Lorentz factors in the source population. The
exponential cutoff is related to the electron temperature by β=mc2/(kT),
and α is the electronic power-law index. When
discussing the thermodynamics of Boltzmann power-law ensembles, we will
redefine the power-law index as δ=α+2,
so that a thermal Maxwell–Boltzmann distribution corresponds to δ=0
and γ1=1. In spectral
averages it is customary to define the electron index by α
as done in Eq. (2.2). The
average is carried out as [6]
1
the lower edge of Lorentz factors in the source population. The
exponential cutoff is related to the electron temperature by β=mc2/(kT),
and α is the electronic power-law index. When
discussing the thermodynamics of Boltzmann power-law ensembles, we will
redefine the power-law index as δ=α+2,
so that a thermal Maxwell–Boltzmann distribution corresponds to δ=0
and γ1=1. In spectral
averages it is customary to define the electron index by α
as done in Eq. (2.2). The
average is carried out as [6]and the spectral fit is based on the E2-rescaled flux densities:
where d is the distance to the source. The spectral maps of the microquasars in Fig. 1, Fig. 2 and Fig. 3 are fitted with the unpolarized flux density dNT+L=dNT+dNL of electron populations ρi=1,2 specified in Table 1. Each electron density generates a cascade ρi, and the wideband fit is obtained by adding two cascade spectra, labeled ρ1 and ρ2 in the figures.
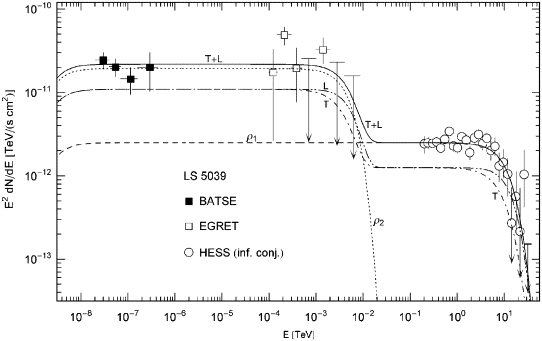
Fig. 1. γ-Ray wideband of the microquasar LS 5039.
BATSE data points from Ref. [8], EGRET
points from Refs. [9] and [10], and HESS
points from Ref. [11]. BATSE and
EGRET data refer to the associated EGRET source ![]() ,
HESS points to
,
HESS points to ![]() at the inferior conjunction as defined in Ref. [11]. The solid
line T+L depicts the unpolarized differential tachyon flux dNT+L/dE,
obtained by adding the flux densities ρ1,2
of two electron populations and rescaled with E2
for better visibility of the spectral curvature, cf. (2.4). The
transversal (T, dot-dashed) and longitudinal (L, double-dot-dashed)
flux densities dNT,L/dE
add up to the total flux T+L. The exponential decay of the cascades ρ1,2
sets in at about Ecut≈(mt/m)kT,
implying cutoffs at 5 TeV for the ρ1
cascade and at 2 GeV for ρ2,
which terminate the spectral plateaus. The unpolarized flux T+L is the
actual spectral fit, the parameters of the electron densities are
recorded in Table 1.
at the inferior conjunction as defined in Ref. [11]. The solid
line T+L depicts the unpolarized differential tachyon flux dNT+L/dE,
obtained by adding the flux densities ρ1,2
of two electron populations and rescaled with E2
for better visibility of the spectral curvature, cf. (2.4). The
transversal (T, dot-dashed) and longitudinal (L, double-dot-dashed)
flux densities dNT,L/dE
add up to the total flux T+L. The exponential decay of the cascades ρ1,2
sets in at about Ecut≈(mt/m)kT,
implying cutoffs at 5 TeV for the ρ1
cascade and at 2 GeV for ρ2,
which terminate the spectral plateaus. The unpolarized flux T+L is the
actual spectral fit, the parameters of the electron densities are
recorded in Table 1.
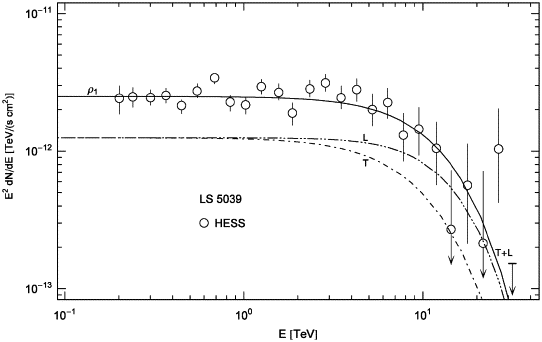
Fig. 2. Close-up of the HESS spectrum of LS 5039 in Fig. 1. The TeV spectral map coincides with the ρ1 cascade, since the ρ2 flux is exponentially cut at 2 GeV. T and L stand for the transversal and longitudinal flux components, and T+L labels the unpolarized flux. The HESS points define a spectral plateau in the high GeV range typical for cascade spectra, followed by exponential decay. The spectral curvature is generated by the Boltzmann factor in the electron densities. If rescaled, this spectral map is quite similar to the cascade spectra of the Markarian galaxies Mkn 501 and Mkn 421 in Figs. 5 and 6 of Ref. [6].
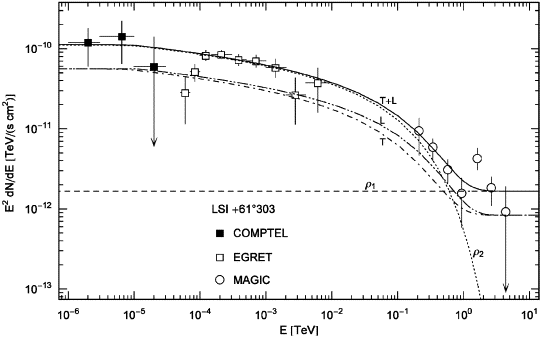
Fig. 3. Spectral map of the microquasar LSI +61°303,
associated with the EGRET source 3EG J0241+6103. COMPTEL points from
Ref. [12], EGRET data
from Refs. [13] and [14], and MAGIC
points from Ref. [15]. The plots
are labeled as in Fig. 1. The χ2-fit
is done with the total unpolarized tachyon flux T+L and subsequently
split into transversal (dot-dashed) and longitudinal
(double-dot-dashed) components. A spectral break at ![]() is visible as edge in the spectral map; exponential decay sets in at
the cutoff frequency
is visible as edge in the spectral map; exponential decay sets in at
the cutoff frequency ![]() .
In the extended crossover regime between the spectral break and the
spectral cutoff, the decay is gradual but not power law, with electron
index α=1. (A power-law crossover,
.
In the extended crossover regime between the spectral break and the
spectral cutoff, the decay is gradual but not power law, with electron
index α=1. (A power-law crossover, ![]() ,
occurs for electron indices α>1, cf. Ref. [6]).
,
occurs for electron indices α>1, cf. Ref. [6]).
Electronic source densities ρ1,2 generating the γ-ray broadband of the microquasars LS 5039 and LSI +61°303
Each ρi stands for
a Boltzmann power-law density ![]() defined by parameters
defined by parameters ![]() ,
cf. (2.2). α
is the electronic power-law index, β=mc2/(kT)
the cutoff parameter in the Boltzmann factor, and γ1
the lower edge of Lorentz factors in the electronic source population ρi.
The amplitude of the tachyon flux generated by ρi
is determined by
,
cf. (2.2). α
is the electronic power-law index, β=mc2/(kT)
the cutoff parameter in the Boltzmann factor, and γ1
the lower edge of Lorentz factors in the electronic source population ρi.
The amplitude of the tachyon flux generated by ρi
is determined by ![]() ,
from which the electron count ne
is inferred at the indicated distance, cf. (2.5). (The
subscript 1 in
,
from which the electron count ne
is inferred at the indicated distance, cf. (2.5). (The
subscript 1 in ![]() and ne has been dropped). kT
is the electron temperature. In the thermodynamic variables, we
identify δ=α+2
and put N=ne,
cf. Sections 3 and 4. The cascades
labeled ρi in Fig. 1, Fig. 2 and Fig. 3 are
obtained by averaging the tachyonic radiation densities (2.1) with the
electron distributions ρi,
cf. (2.3) and (2.4). The
parameters α, β, γ1,
and
and ne has been dropped). kT
is the electron temperature. In the thermodynamic variables, we
identify δ=α+2
and put N=ne,
cf. Sections 3 and 4. The cascades
labeled ρi in Fig. 1, Fig. 2 and Fig. 3 are
obtained by averaging the tachyonic radiation densities (2.1) with the
electron distributions ρi,
cf. (2.3) and (2.4). The
parameters α, β, γ1,
and ![]() are extracted from the least-squares fit T+L in the figures. As for the
thermal high-energy population ρ1
of LSI +61°303, it is not yet possible to determine the spectral cutoff
and the electron temperature from the presently available TeV data.
are extracted from the least-squares fit T+L in the figures. As for the
thermal high-energy population ρ1
of LSI +61°303, it is not yet possible to determine the spectral cutoff
and the electron temperature from the presently available TeV data.
As for the electron count n1,
we use a rescaled parameter ![]() for the fit:
for the fit:
In Fig. 1 and Fig. 2, we
depict the spectral map of the microquasar LS 5039, located at a
distance of 2.5 kpc, a compact object orbiting a massive
O-star [8], [9], [10] and [11]. Mass
estimates and orbital parameters are given in Refs. [1] and [2]; we do not
list them here, as they are not required to infer the thermodynamic
parameters of the electron plasma. LS 5039 is associated with the
unidentified EGRET source ![]() and the TeV source
and the TeV source ![]() ,
cf. Refs. [11] and [18]. The
tachyonic spectral maps are further explained in the figure captions.
The GeV spectrum in Fig. 1 can be
compared to the spectral map in Fig. 2 of Ref. [10], based on
inverse Compton scattering.
,
cf. Refs. [11] and [18]. The
tachyonic spectral maps are further explained in the figure captions.
The GeV spectrum in Fig. 1 can be
compared to the spectral map in Fig. 2 of Ref. [10], based on
inverse Compton scattering.
Fig. 3 shows the tachyonic spectral map of the microquasar LSI +61°303, at d≈2 kpc, associated with the unidentified EGRET source 3EG J0241+6103, cf. Refs. [12], [13], [14], [15], [19] and [20]. Estimates of the orbital parameters of this binary system, a massive Be star with a compact companion, are given in Refs. [3] and [4]. Inverse-Compton fits of the EGRET spectrum can be found in Figs. 2–4 of Ref. [14]. The thermodynamic variables of the electron populations are discussed in Section 3, and estimates of the internal energy and the specific heats are derived in Section 4. The spectral fits in Fig. 1, Fig. 2 and Fig. 3 are performed with the unpolarized tachyon flux. At γ-ray energies, the speed of tachyons is close to the speed of light, the basic difference to electromagnetic radiation being the longitudinal flux component. The polarization of tachyons can be determined from transversal and longitudinal ionization cross-sections [21] and [22].
3. Caloric equation of state and heat capacities of electronic power-law distributions
The exponentially cut power-law distribution (2.2) is
obtained from the momentum-space density dρ∝H-δe-H/(kT)d3p,
where H=mγ is the free
Hamiltonian, and the electronic Lorentz factors range in the interval γ1 γ<∞.
The power-law exponent δ is related to the electron
index in Eq. (2.2) by δ=α+2.
The thermodynamic formalism employed is standard, and no derivations
are given, although we will consider stability conditions such as the
positivity of the specific heat and compressibility. We will discuss
the low- and high-temperature expansions of the caloric equation of
state and the isochoric heat capacity, in particular their qualitative
dependence on the power-law index δ. The typical
range of δ in spectral averages is narrow, very
rarely outside the interval 0
 δ
δ 4,
cf. Refs. [23], [24], [25], [26], [27], [28], [29], [30] and [31]. The
relativistic thermal Maxwell–Boltzmann distribution in 3D is recovered
with δ=0 and γ1=1,
cf. Ref. [32]. Here, we
will study power-law ensembles with arbitrary real index δ.
We start with the classical grand partition function
where H/m=γ and β=m/(kT). The thermal wavelength reads
 mγ, the factor γ−δ
in density (3.2) can be
generated by analytic continuation in the space dimension. The fact
that the exponent δ varies only in a narrow range
also suggests treating it like a dimension rather than an intensive
variable when setting up the thermodynamic formalism for power-law
ensembles. We find
mγ, the factor γ−δ
in density (3.2) can be
generated by analytic continuation in the space dimension. The fact
that the exponent δ varies only in a narrow range
also suggests treating it like a dimension rather than an intensive
variable when setting up the thermodynamic formalism for power-law
ensembles. We findwhere
The momentum integration (3.3) is over R3, as we at first consider the full range of Lorentz factors, 1
 γ<∞.
In Section 4, we
will discuss a truncated electron density, restricting the integration
range in Eq. (3.3) to H
 H1=mγ1,
γ1>1, which amounts to
replacing the lower integration boundary in Eq. (3.4) by γ1;
in particular, we will study ultra-relativistic ensembles with
high-energy threshold γ1
 1.
In this section, we assume γ1=1.
The summation in Eq. (3.1) gives
Here, m3V is dimensionless, so that m→mc/
 when restoring units, and β=mc2/(kT).
On eliminating the fugacity e-α,
we obtain the caloric equation of state:
when restoring units, and β=mc2/(kT).
On eliminating the fugacity e-α,
we obtain the caloric equation of state:The chemical potential reads
and the entropy is defined as
By making use of N=log Z, we find
The homogeneity relation, S/N=S(δ,β,V/N,1), is satisfied, and we may substitute β(U/N) by solving (3.8).
We note the Helmholtz free energy U – TS,
This is the energy required to shift the exponential cutoff of the power-law slope, that is, to vary the electron temperature without changing volume and power-law index. The isothermal compressibility is
Thermodynamic stability, d2S
 0
at dS=0
(with δ kept fixed) requires CV
 0
and κT
 0,
the latter is obviously satisfied. As for the first, we note ∂K(δ,β)/∂β=-K(δ-1,β)
and the Schwarz inequality K2(δ-1,β)<K(δ,β)K(δ-2,β),
which implies CV>0.
As for energy and number fluctuations, we note the variances
0,
the latter is obviously satisfied. As for the first, we note ∂K(δ,β)/∂β=-K(δ-1,β)
and the Schwarz inequality K2(δ-1,β)<K(δ,β)K(δ-2,β),
which implies CV>0.
As for energy and number fluctuations, we note the varianceswhich result in
where
The adiabatic compressibility and the adiabatic expansion coefficient read
and are calculated via the identities [33]
where γC denotes the heat capacity ratio CP/CV. The positivity conditions CV>0 and κT>0 thus imply CP>CV, γC>1, and κT>κS>0; the adiabatic expansivity αS is negative.
The low-temperature expansion of the equation of state (3.8) reads
The leading order is just the non-relativistic result; at low temperature, the power-law index enters only into the relativistic corrections. Here and in the following, the asymptotic expansions are obtained by term-by-term differentiation of the log K series in Appendix A.
The high-temperature expansions of the internal energy and the
isochoric specific heat differ qualitatively in different δ
ranges. We define the coefficients
In the range 1<δ<3, the next-to-leading order is modified as
In the interval 3<δ<4, we obtain
and for 4<δ<5
Finally, for δ>5
The leading-order coefficients are all positive, which is easy to see except for CV in Eq. (3.27), where positivity follows from the Schwarz inequality, cf. after (3.14). Regarding units, we note
In the case of integer δ, there appear
singularities in the expansion coefficients, which cancel if ε
expanded, cf. Appendix A and
Ref. [7]. We list the
equation of state and the specific heat for integer power-law index 0 δ
δ 5.
Outside this range, the indicated orders of expansions (3.23) and (3.27) are
singularity free and can be used even at integer δ.
As for the caloric equation, we find
The case δ=0 is the high-temperature limit of a Maxwell–Boltzmann distribution [32]. The specific heat is safely positive, but approaches zero in the high-temperature limit for power-law indices δ
 3.
3.
4. Ultra-relativistic Boltzmann power laws
We proceed as in Section 3, but
restrict the momentum integration in the partition function (3.1) to
ultra-relativistic Lorentz factors, so that ![]() with γ ranging above a high-energy edge γ1
with γ ranging above a high-energy edge γ1 1.
In the partition function (3.1), we
substitute the truncated density
 H1:
H1:with density ρ in Eq. (3.2), so that
Eqs. (3.5), (3.6), (3.7), (3.8), (3.9), (3.10), (3.11), (3.12), (3.13), (3.14), (3.15), (3.16), (3.17), (3.18) and (3.19) remain valid with K(δ,β) replaced by K(δ,β,γ1); internal energy and heat capacity read
Schwarz's inequality as stated after (3.14) also applies to K(δ,β,γ1), so that the maximum condition d2S
 0
at fixed δ
and γ1 is met. The
low-temperature expansion (3.20) of the
internal energy is replaced by [7]
0
at fixed δ
and γ1 is met. The
low-temperature expansion (3.20) of the
internal energy is replaced by [7]where
If γ1≈1, these expansions break down; the low-temperature expansion of K(δ,β,γ1) in the case of small but non-vanishing υ1 is discussed in Ref. [7]. At γ1=1, the low-temperature expansions (3.20) and (3.21) apply. In this section, we consider ultra-relativistic power-law ensembles, with Lorentz factors exceeding a high-energy threshold γ1
 1.
1.
The high-temperature expansion of the internal energy and the
specific heat as stated in Eqs. (3.23), (3.24), (3.25), (3.26) and (3.27) can also
be used for γ1>1,
if we replace the coefficients ck(δ)
in Eq. (3.22) by
 1,
the hypergeometric function in ck(δ,γ1)
can be dropped, cf. (A.21). However,
care must be taken if the power-law exponent δ is
integer, as singularities emerge in the coefficients of the
hypergeometric series, cf. (A.19), (A.20), (A.21), (A.22) and (A.23). For
integers 0
 δ
δ 5
and ultra-relativistic γ1
 1,
the high-temperature expansions of the internal energy read
1,
the high-temperature expansions of the internal energy readThe corresponding high-temperature expansions of the ultra-relativistic heat capacity at integer power-law index 0
 δ
δ 5
are
5
areThe expansions in Eqs. (4.9) and (4.10) are
ultra-relativistic, terms of order ![]() are systematically dropped, cf. (A.22). The
high-temperature expansions valid for γ1=1
are stated in Eqs. (3.28) and (3.29). In Table 2, we list
the internal energy and heat capacities of the electron populations in
the microquasars LS 5039 and LSI +61°303. The input parameters are
inferred from the spectral fits in Fig. 1, Fig. 2 and Fig. 3, as
explained in the table captions.
are systematically dropped, cf. (A.22). The
high-temperature expansions valid for γ1=1
are stated in Eqs. (3.28) and (3.29). In Table 2, we list
the internal energy and heat capacities of the electron populations in
the microquasars LS 5039 and LSI +61°303. The input parameters are
inferred from the spectral fits in Fig. 1, Fig. 2 and Fig. 3, as
explained in the table captions.
Internal energy and heat capacities of the electronic source densities ρ1,2 in the microquasars
| U/(nemc2) | U (erg) | CV (erg/K) | CP/CV | |
|---|---|---|---|---|
| LS 5039 | ||||
| ρ1 | 6.83×10⁹ | 5.4×1050 | 4.0×1031 | 1.33 |
| ρ2 | 2.79×10⁶ | 1.7×1048 | 3.1×1032 | 1.33 |
| LSI +61°303 | ||||
| ρ1 | — | — | 1.7×1031 | 1.33 |
| ρ2 | 2.57×10⁷ | 5.9×1049 | 3.4×1031 | 12.4 |
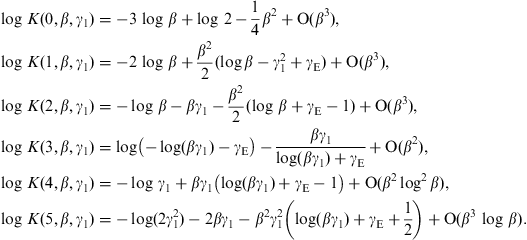
U/(nemc2) denotes the internal energy normalized with the rest mass of the respective electron population ρi. The internal energy U (erg) of the thermal densities ρ1,2 in LS 5039 and ρ1 in LSI +61°303 is calculated via the high-temperature expansion U(δ=0) in Eq. (3.28). The series U(δ=3,γ1) in Eq. (4.9) is used for the ultra-relativistic power-law density ρ2 of LSI +61°303. The input parameters δ=α+2, β, γ1, and N=ne are listed in Table 1. The isochoric heat capacity is calculated by means of the series expansions CV(δ=0) in Eq. (3.29) and CV(δ=3,γ1) in Eq. (4.10). The adiabatic index CP/CV is obtained from identity (3.17). The internal energy of the thermal population ρ1 in LSI +61°303 remains undetermined, as the cutoff parameter β of this distribution could not be extracted from the spectral fit in Fig. 3. Regarding the ultra-relativistic power-law density ρ2 of LSI +61°303, we note βγ1≈1.9×10⁻⁵, cf. Table 1, so that the quoted high-temperature expansions of internal energy and specific heat are applicable, obtained from the ultra-relativistic expansion K(δ=3,β,γ1) listed in Eq. (A.22).
5. Conclusion
We have investigated superluminal radiation from ultra-relativistic electron populations in γ-ray binaries and explained how to obtain the thermodynamic variables of the source densities. We demonstrated that the γ-ray spectra of the microquasars can be fitted with tachyonic cascade spectra. The spectral curvature is intrinsic and reproduced by the tachyonic spectral densities (2.1) averaged with thermal and power-law electron distributions. In Table 2, we have given estimates of the internal energy and the heat capacities of the electron plasmas in the microquasars LS 5039 and LSI +61°303. More generally, we have shown that Boltzmann power-law densities admit a stable and extensive entropy function (3.11). On that basis, we have derived the caloric equation of state and studied the temperature scaling of the internal energy and the heat capacities in the high-temperature regime, in particular the dependence of the scaling exponents on the electronic power-law index.
The tachyonic radiation densities (2.1) are generated by electrons in uniform motion. In Ref. [17], we studied superluminal radiation from ultra-relativistic electrons orbiting in strong magnetic fields and derived the pitch-angle scaling of the radiation densities. In the zero-magnetic-field limit, the tachyonic synchrotron densities converge to the spectral densities for uniform motion [34]. Orbital curvature induces modulations in the spectral slopes of densities (2.1), but these ripples are attenuated when performing a pitch-angle average, cf. Figs. 1–3 in Ref. [17]. Thus we can use uniform radiation densities in the spectral fits even in the presence of magnetic fields, for instance, if the compact companion is a magnetized neutron star [1] and [4]. The orbital parameters of the binary system do not directly enter into the spectral fit either. If one considers microquasars as scaled-down Galactic counterparts of active galactic nuclei [2] and [10], one would rather expect the spectra to be determined by the global thermodynamic parameters of the electron populations in these objects, which are in turn inferred from the spectral maps, cf. Table 1.
We have focused on γ-ray spectra, which can be fitted with
ultra-relativistic electron populations in the high-temperature regime.
Otherwise we have to consider the quantized tachyonic spectral
densities [6] instead of
the classical limit (2.1). In the
low-temperature regime, we also have to replace the Boltzmann power-law
density in the spectral average (2.3) with its
quantized fermionic counterpart. As for tachyonic X-ray spectra
obtained from diffraction gratings, the tachyon mass of 2 keV
has to be included in the dispersion relation, ![]() ,
when parametrizing the glancing angle in the Bragg condition with
energy, which affects the shape of the spectral maps in the X-ray
bands. This will be discussed elsewhere.
,
when parametrizing the glancing angle in the Bragg condition with
energy, which affects the shape of the spectral maps in the X-ray
bands. This will be discussed elsewhere.
Acknowledgements
The author acknowledges the support of the Japan Society for the Promotion of Science. The hospitality and stimulating atmosphere of the Centre for Nonlinear Dynamics, Bharathidasan University, Trichy, and the Institute of Mathematical Sciences, Chennai, are likewise gratefully acknowledged.
References
Appendix A. High-temperature asymptotics of Gibbs free energy and entropy
The low- and high-temperature expansions of the partition
function
The first few orders of the low-temperature expansion read [7]
The high-temperature expansion is composed of two series:
where
The general term of the series indicated in Eq. (A.5) is (-)k(1/2)kΓ(3-δ-2k)β2k/k!, where (1/2)k denotes the falling factorial, cf. Ref. [7]. The second series in Eq. (A.4) reads
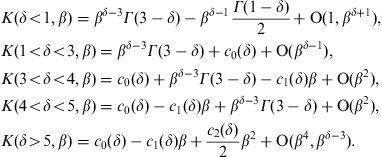
with coefficients ck(δ) defined in Eq. (3.22). To get an overview, we summarize the leading orders of expansion (A.4), with power-law index δ ranging in the indicated intervals:
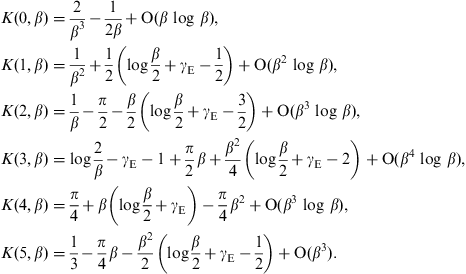
At integer δ, pole singularities emerge in the coefficients of series (A.5) and (A.6), which cancel in Eq. (A.4) if ε expanded [7]:
γE is Euler's constant. At integer δ<0 and δ>5, expansions K(δ<1,β) and K(δ>5,β) in Eq. (A.7) can be used, as the indicated orders are singularity free. This settles the high-temperature expansion of the partition function (A.1) for arbitrary power-law index δ.
The high-temperature expansion of the chemical potential (3.9), the
Helmholtz free energy (3.12) and the
Gibbs potential F+PV,
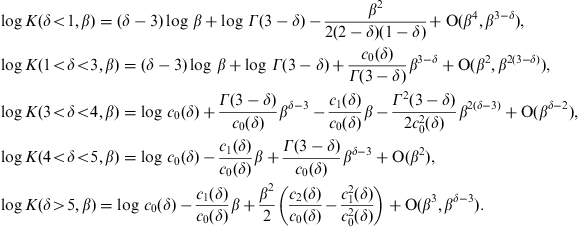
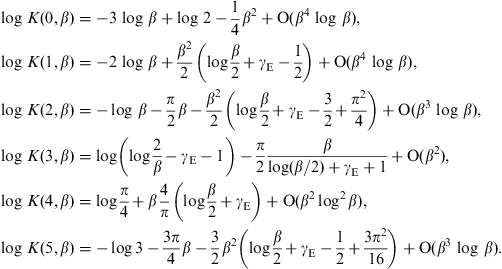
Internal energy and specific heat are found by term-by-term differentiation of the log K series. For integers 0
 δ
δ 5,
singularities occur in the series coefficients in Eq. (A.10). In this
case, we use (A.8) to find
5,
singularities occur in the series coefficients in Eq. (A.10). In this
case, we use (A.8) to findThe high-temperature expansion of the entropy function (3.11) is obtained by substituting the asymptotic series of the caloric equation of state and the chemical potential into
Alternatively, we may use the log K series in Eqs. (A.10) and (A.11) and term-by-term differentiation to find the β→0 asymptotics of S, starting with
We note the leading-order asymptotics
and S0 approaches a finite limit,
We finally discuss the low- and high-temperature asymptotics
of the ultra-relativistic partition function, cf. (4.1):
so that
Here, N is to be identified with the renormalized electron count
where
It remains to settle the high-temperature limit, the β→0
asymptotics of K(δ,β,γ1)
in Eq. (A.16). As in
Eq. (A.4), the
expansion is composed of two series [7]:
with coefficients ck(δ,γ1) defined in Eq. (4.8). The high-temperature expansion of
so that the expansion parameter of series
 1,
despite of β being small, the low-temperature
expansion (A.18) applies.
At integer δ, the coefficients ck(δ,γ1)
in Eq. (A.20) become
singular owing to poles in the coefficients of the hypergeometric
series. They can be dealt with by ε expansion and
are canceled by corresponding poles of ![]() in Eq. (A.19), which
arise in the Γ-functions in Eq. (A.5). In the
ultra-relativistic limit, γ1
in Eq. (A.19), which
arise in the Γ-functions in Eq. (A.5). In the
ultra-relativistic limit, γ1 1
(but still βγ1
 1), we find, for integers 0
 δ
δ 5,
5,
There are two expansion parameters in these series, β in
Here, we have dropped the
 1,
provided that β is sufficiently small to ensure βγ1
 1.
1.
The ultra-relativistic high-temperature asymptotics of entropy
is obtained by means of (A.13), with K(δ,β)
replaced by K(δ,β,γ1)
in the reduced entropy function S0.
For power-law indices δ 3,
the leading order of S0 is
independent of the ultra-relativistic threshold γ1,
cf. (A.23), so that
the high-temperature limit of S0
in Eq. (A.14) remains
unchanged. For power-law indices δ>3,
the reduced entropy admits a finite limit,
 ![]() ,
cf. (A.10) and (A.21).
,
cf. (A.10) and (A.21).


