Volume 366, Issues 4-5, 2 July 2007, Pages 289-297
Roman
Tomaschitz ,
a,
,
a,

Abstract
We study tachyonic synchrotron densities of ultra-relativistic electrons in helical motion. There is a longitudinally polarized spectral component due to the negative mass square of the superluminal quanta. The helical pitch-angle scaling of the transversal and longitudinal spectral densities is investigated, in particular the transition from circular to rectilinear motion. The magnetic field induces oscillations along the power-law slopes of the superluminal radiation densities, whose amplitude depends on the pitch angle. At moderate field strength and ultra-relativistic orbital speed, the modulations are tiny, but they become quite pronounced in the surface fields of γ-ray pulsars, resulting in cockscomb distributions. A tachyonic spectral fit to the γ-ray flux of the binary pulsar PSR B1259–63 is performed. The γ-ray wideband of this millisecond pulsar is reproduced by a tachyonic cascade spectrum, capable of generating the spectral curvature in double-logarithmic plots as well as the extended spectral plateau defined by ISGRI, OSSE, COMPTEL, and EGRET flux points.
Keywords: Tachyonic synchrotron radiation; Superluminal curvature radiation; Longitudinal polarization; Cascade spectra; Pulsar magnetospheres
PACS classification codes: 41.60.Ap; 03.50.Kk; 95.30.Gv; 97.60.Gb
Article Outline
1. Introduction
We investigate tachyonic synchrotron emission from electrons in pulsar magnetospheres. The goal is to provide quantitative evidence for this radiation by working out a specific example, a tachyonic spectral fit to the γ-ray spectrum of the binary pulsar PSR B1259–63 orbiting around the massive Be star SS 2883. When tachyonic spectral densities are averaged with thermal or power-law electron densities, this leads to cascade spectra [1] and [2], extended spectral plateaus followed by power-law decay terminating in exponential decay. A glance at the spectral map of PSR B1259–63 suggests that it can readily be fitted by a cascade spectrum.In Section 2, the tachyonic spectral densities of electrons in helical orbits and their pitch-angle scaling are derived. In Section 3, we discuss the pitch-angle averaging and its effect on modulations along the spectral slopes induced by the negative mass-square of the radiation field. In particular, we illustrate the helical cross-over from circular orbits to rectilinear motion in the surface magnetic field of a γ-ray pulsar. In Section 4, we average the tachyonic spectral densities with electronic source populations and perform a wideband fit to the PSR B1259–63/SS 2883 binary system, ranging from high-energy X-rays to TeV γ-rays. In Section 5, we present our conclusions.
We consider electrons in a constant magnetic field B=(0,0,B),
B>0.
The equations of motion read d(γmv)/dt=ev×B.
The helical orbits can be parametrized as
 α
α π.
The speed υ along the orbit is constant. A pitch
angle of π/2
gives circular orbits in the (x,y)-plane,
and α=0
or π means straight uniform motion. We put
  =c=1,
and use the Heaviside–Lorentz system. The electric charge e
is defined negative for electrons, γ is the Lorentz
factor, and m the electron mass. We also admit sign(e)=0
in (1), that is,
planar transversal oscillations, realizable by undulators in storage
rings [3], [4], [5], [6], [7] and [8].
2. Superluminal radiation densities
2.1. High-frequency regime
The tachyonic radiation theory pertinent to a charge in
arbitrary motion has been given in Ref. [1]. The
multipole expansion of the superluminal Poynting vectors is summarized
in Eqs. (2), (3) and (4). We
introduce polar coordinates with B as
polar axis and polar angle θ, and consider the
tachyonic wave vector in the (y,z)-plane,
so that k:=k(ω)n,
n=(0,sinθ,cosθ).
Wave number and frequency are related by the superluminal dispersion
relation, ![]() ,
where mt
is the mass of the tachyonic quanta. The sign convention is
,
where mt
is the mass of the tachyonic quanta. The sign convention is ![]() ,
so that the plus-sign in the dispersion relation implies a negative
mass square. We define two transversal polarization vectors, ε
,
so that the plus-sign in the dispersion relation implies a negative
mass square. We define two transversal polarization vectors, ε :=(0,−cosθ,sinθ),
and ε
 :=ε
:=ε ×n,
so that n, ε
 and ε
and ε constitute an orthonormal triad, ε
 =−ε
=−ε ×n.
We study the ultra-relativistic limit, γ
 1.
1.
The angular-integrated power radiated in the nth
harmonic can readily be assembled from Eqs. (2.27), (2.28) and (2.31)
of Ref. [1],
 c)≈1.0×10⁻¹³
is the tachyonic fine structure constant. The superluminal radiation
field, a Proca field with negative mass square, is coupled by minimal
substitution to the subluminal current, and q is
the tachyonic charge of the source particle. The tachyon mass is mt≈2.15 keV/c2.
These estimates are obtained from hydrogenic Lamb shifts [9]. The
tachyonic frequencies and wave numbers in (2) read
c)≈1.0×10⁻¹³
is the tachyonic fine structure constant. The superluminal radiation
field, a Proca field with negative mass square, is coupled by minimal
substitution to the subluminal current, and q is
the tachyonic charge of the source particle. The tachyon mass is mt≈2.15 keV/c2.
These estimates are obtained from hydrogenic Lamb shifts [9]. The
tachyonic frequencies and wave numbers in (2) readThe squared multipole coefficients can be calculated in closed
form [1],
 ,
, )
to the radiated power can easily be distinguished; the term stemming
from the ε
 -polarized
component of the radiation field has the sign2(e)-factor
attached. Moreover, by putting sign2(e)=0
in (4), we find the
transversal power radiated by oscillating charges in undulator fields.
The electromagnetic counterpart of (2), (3) and (4) is recovered
in the limit of vanishing tachyon mass [10].
The integrals ![]() in (2) give the
power transversally or longitudinally radiated in the harmonic ωn.
We are interested in the large-n asymptotics,
in (2) give the
power transversally or longitudinally radiated in the harmonic ωn.
We are interested in the large-n asymptotics,
and the argument zn of the Bessel functions in (4) is expanded as
In (2), we expand
the integrands in θ−θc,
at the stationary phase, dzn(θc)/dθ=0,
which reads
We introduce a new integration variable ψ in (2),
where γ=(1−υ2)−1/2
 1, and approximate
In the vicinity of θc, the
and the Bessel functions in (12) by their Nicholson approximation. The latter applies for large positive n and z, so that z/n≈1 and z<n,
In the preceding notation, this means
The integration boundaries in (2) can be
extended to infinity, given the decay of the integrands. Assembling the
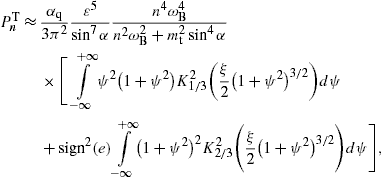
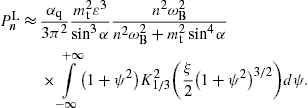
enumerated approximations, we arrive at the transversal power
coefficients,
Here, we defined
with ε in (10). The transversal power radiated in ε
 -polarization
is given by the sign2(e)
term, and the ε
 -polarized
transversal radiation by the
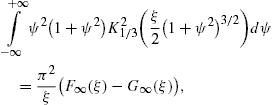
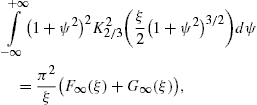
 where the spectral functions on the right-hand side read
The easiest way to derive these identities is to write K1/3 and K2/3 in terms of Ai(x) and its derivative, and then to use the standard integral representation for Ai(x), cf. Section 2.2.
The total power transversally and longitudinally radiated is
obtained by summing over the individual modes, ![]() .
We pass to continuous frequencies by identifying ω=ωn≈ωBn/sin2α,
so that the continuous spectral densities read
.
We pass to continuous frequencies by identifying ω=ωn≈ωBn/sin2α,
so that the continuous spectral densities read ![]() ,
with n=(ω/ωB)sin2α.
We find ξ in (17) as
,
with n=(ω/ωB)sin2α.
We find ξ in (17) as
The restriction z<n
on the Nicholson asymptotics (13) translates
into ω>ωb.
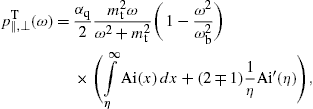
In this frequency band, we find the transversal density, cf. (15) and (18),
where ξ and ωb are defined in (20). The lower plus-sign in (22) refers to the
 -polarization.
pT(ω)
in (21) stands for
the total transversal radiation; we have sign2(e)=1.
The longitudinal density is assembled with (16) and (18),
-polarization.
pT(ω)
in (21) stands for
the total transversal radiation; we have sign2(e)=1.
The longitudinal density is assembled with (16) and (18),The spectral functions F∞(ξ), G∞(ξ), and L∞(ξ) are defined in (19). The pitch angle enters in pT,L(ω) via the rescaled gyrofrequency, ωB→ωBsinα, cf. (20).
2.2. Analytic continuation into the low-frequency band
Densities (21), (22) and (23) can be
continued into the low-frequency regime, ω ωb,
by means of Airy functions. The Airy representation of the spectral
functions (19) reads
so that ξ=(2/3)|η|3/2, cf. (20), and find
 ωb,
and they also constitute the analytic continuation into the lower
frequency band ω
 ωb,
where η(ω,α)
is negative. The lower plus-sign in (26) refers to
the
  -polarization.
The pitch angle enters only via η(ω,α),
cf. (25).
3. Pitch-angle averaging
We perform a pitch-angle average with density [11]
and Ai′(η)/η in (26) is replaced by
Here, η0(ω):=η(ω,α=π/2), cf. (25), so that η=η0/sin2/3α. The averages (29) and (30) remain unaltered, if we replace the integration over
where λ1,2>−1 and 0
 A
A 1.
dρλ
is defined in (28). The
distribution (31) is
normalized to one,
 We denote the averaged densities by  pT,L(ω)
 σ.
σ.
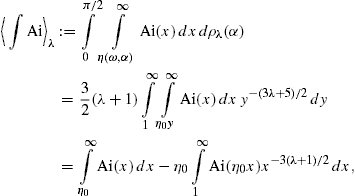
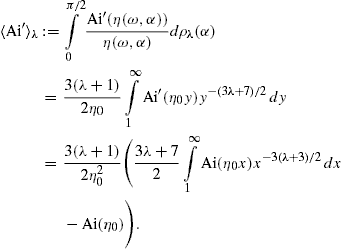
The averages  ∫Ai
∫Ai λ
and
λ
and  Ai′
Ai′ λ
in (29) and (30) depend on ω
only via η0(ω),
cf. after (30). We briefly
discuss their |η0|
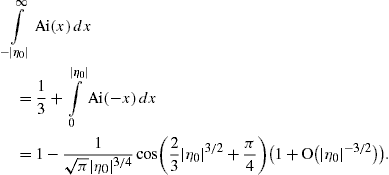
 1 asymptotics, starting with the
low-frequency band, ω
 ωb,
cf. after (27), where η0
is negative. In leading order,
where β
 0.
The systematic asymptotic expansion of the integral (35) can be
obtained by substituting the asymptotic series of the Airy function and
applying term-by-term integration, which results in a series of
incomplete Γ-functions. The latter are then replaced by their
asymptotic series. The leading order stated in (35) is
independent of the exponent β, which enters
linearly in the next-to-leading order; if β is
large, we have to require β/|η0|3/2
 1
for the O-term to be small. In (29), we also
need
1
for the O-term to be small. In (29), we also
needSubstituting the leading-order asymptotics (34), (35) and (36) into the averages (29) and (30), we find
Thus the averaged spectral densities (as defined by (26) and (27) with substitutions (32) and (33)) converge for large |η0| to the densities generated by a charge in uniform motion, cf. Section 4, irrespectively of the choice of parameters in the pitch-angle distribution (31).
We turn to the upper frequency range, ω ωb,
where η0(ω)
is positive. The asymptotics of
  ∫Ai
∫Ai λ
and
λ
and  Ai′
Ai′ λ
is obtained from
The averaged spectral densities vanish for large (and even moderate) positive η0(ω), reflecting the fact that the spectral densities of a charge in uniform motion vanish identically for ω
 ωb,
cf. Section 4.
The pitch-angle distribution dσA,λ1,λ2(α)
is peaked in the interval [0,π/2],
at ![]() ,
provided that λ1>0.
If −1<λ1
,
provided that λ1>0.
If −1<λ1 0,
it decreases monotonically to zero. The peak in the interval [π/2,π]
occurs at
 ![]() .
If −1<λ2<0,
the density increases in this interval from zero to infinity. For
instance, λ1,2=1
gives αp1=π/4;
λ1,2=1/3
gives αp1=π/6,
and λ1,2=3
amounts to a peak at αp1=π/3.
The respective second peak in [π/2,π]
is obtained as αp2=π−αp1.
If A=1/2
and λ1=λ2,
the density is symmetric around α=π/2.
If λ1,2>0,
it vanishes at the interval boundaries and π/2.
These three pitch angles correspond to the limit cases of rectilinear
motion parallel and antiparallel to the magnetic field, and to circular
orbits orthogonal to B. If λ1,2
is negative or close to zero, the average is dominated by pitch angles
close to zero and π, so that the radiation density
generated in uniform motion is prevalent. The latter is obtained by
performing the zero-pitch-angle limit sinα→0
in (26) and (27), cf. Ref. [12] and Fig. 1 and Fig. 2. If λ1,2
.
If −1<λ2<0,
the density increases in this interval from zero to infinity. For
instance, λ1,2=1
gives αp1=π/4;
λ1,2=1/3
gives αp1=π/6,
and λ1,2=3
amounts to a peak at αp1=π/3.
The respective second peak in [π/2,π]
is obtained as αp2=π−αp1.
If A=1/2
and λ1=λ2,
the density is symmetric around α=π/2.
If λ1,2>0,
it vanishes at the interval boundaries and π/2.
These three pitch angles correspond to the limit cases of rectilinear
motion parallel and antiparallel to the magnetic field, and to circular
orbits orthogonal to B. If λ1,2
is negative or close to zero, the average is dominated by pitch angles
close to zero and π, so that the radiation density
generated in uniform motion is prevalent. The latter is obtained by
performing the zero-pitch-angle limit sinα→0
in (26) and (27), cf. Ref. [12] and Fig. 1 and Fig. 2. If λ1,2 1, the distribution (31) has two
peaks close to π/2,
even though it vanishes at π/2,
so that the synchrotron densities (26) and (27) at sinα≈1
dominate the average.
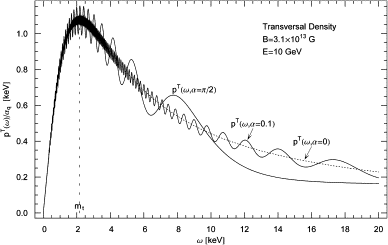
Fig. 1. Transversal tachyonic spectral density pT(ω), cf. (26), in the polar surface field, B≈3.1×10¹³ G, of the γ-ray pulsar PSR B1509–58, cf. Refs. [13], [14] and [15]. The electronic orbital energy is 10 GeV. The density is shown for three pitch angles, α=π/2 (circular orbit), α=0.1, and α=0. The latter corresponds to a charge in straight uniform motion, cf. (40). The radiation densities are rescaled with the tachyonic fine structure constant αq, cf. after (2). The gyrofrequency is ωB≈18 eV, the helical curvature radius R≈1.1×10⁻⁶ cm. The break frequency is ωb≈42 MeV. The spectral peak is located at about the tachyon mass, 2 keV, followed by an extended X-ray tail with power-law decay, in contrast to the exponential cutoff in the upper frequency band, cf. (19).
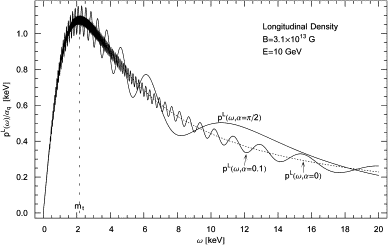
Fig. 2. Longitudinal spectral density pL(ω),
cf. (27). Magnetic
field, electron energy and pitch angles as in Fig. 1. The
oscillations are superimposed by the magnetic field and vanish at zero
pitch angle, for rectilinear motion along the magnetic field lines. The
transversal and longitudinal spectral densities of a uniformly moving
ultra-relativistic electron (dotted curve in Fig. 1 and Fig. 2) coalesce
in the depicted frequency range, ω ωb.
ωb.
The units  =c=1
can easily be restored. Gyroradius (magnetic bending radius, helical
curvature radius) and gyrofrequency are connected by R=c/ωB
in the ultra-relativistic regime. The length of one helical turn is 2πR,
and Rsinα
is the radius of the helical base circle. Electronic energy and Lorentz
factor are related as γ≈1957E
[GeV], so that
 ![]() and
and ![]() ,
and the tachyonic break frequency scales as
,
and the tachyonic break frequency scales as ![]() .
Fig. 1, Fig. 2 and Fig. 3
illustrate the pitch-angle scaling and averaging of the superluminal
radiation densities of ultra-relativistic electrons orbiting in the
polar field of a γ-ray pulsar.
.
Fig. 1, Fig. 2 and Fig. 3
illustrate the pitch-angle scaling and averaging of the superluminal
radiation densities of ultra-relativistic electrons orbiting in the
polar field of a γ-ray pulsar.
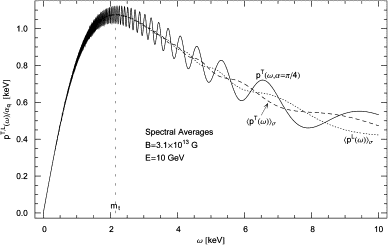
Fig. 3. Transversal and longitudinal spectral
densities  pT,L(ω)
 σ,
averaged with the symmetric pitch-angle distribution dσ(A=1/2,λ1=λ2=1),
cf. (31). This
distribution is peaked at pitch angles of 45° and 135°, in the
cross-over region between the synchrotron regime and rectilinear
motion. Magnetic field and orbital energy as in Fig. 1 and Fig. 2. For
comparison, we also indicate the unaveraged transversal distribution pT(ω)
at these pitch angles,
 ![]() ;
the modulations are wiped out by the averaging.
;
the modulations are wiped out by the averaging.
4. Tachyonic spectral fit to the γ-ray broadband of the binary pulsar PSR B1259–63
To compare to observational spectral maps, we have to perform
a further average over the electron density [2]. We
demonstrated that a pitch-angle average attenuates the modulations in
the spectral slope, cf. Fig. 3, so that
the synchrotron densities approach the spectral densities of a
uniformly moving charge,
We average with electronic power laws exponentially cut with a
Boltzmann density, ![]() .
Parametrized with the Lorentz factor, this reads
.
Parametrized with the Lorentz factor, this reads
The spectral fit is based on the E2-rescaled flux density dNT,L/dE, which is related to the averaged energy density by
where d is the distance to the pulsar. In Fig. 4, Fig. 5 and Fig. 6, we plot the flux density of two thermal electron populations ρ1,2 specified in Table 1. Each electron density generates a cascade ρi, the wideband spectral map is obtained by adding the cascade spectra.
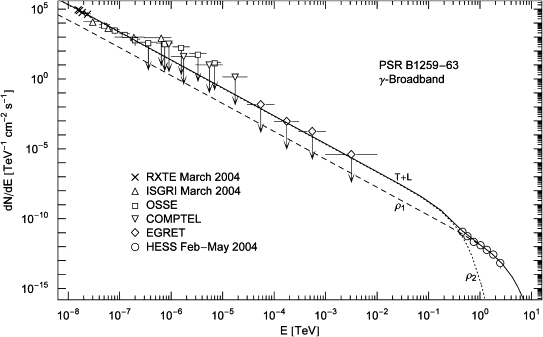
Fig. 4. γ-ray wideband of the binary pulsar PSR B1259–63. RXTE and ISGRI data points from [18], OSSE points from [19], COMPTEL and EGRET upper limits from [20], HESS points from [21]. The solid line T+L is the unpolarized differential tachyon flux dNT+L/dE, obtained by adding the flux densities ρ1,2 of two thermal electron populations. The χ2-fit is based on the first three ISGRI points, the first four OSSE points, and the HESS points. The fourth ISGRI point, the remaining five OSSE points, as well as the COMPTEL and EGRET points are upper limits only. The four depicted RXTE points are at the upper edge of the hard X-ray spectrum detectable with the RXTE proportional counter [18], they suggest a seamless transition into the X-ray band, but have not been included in the least-squares fit.
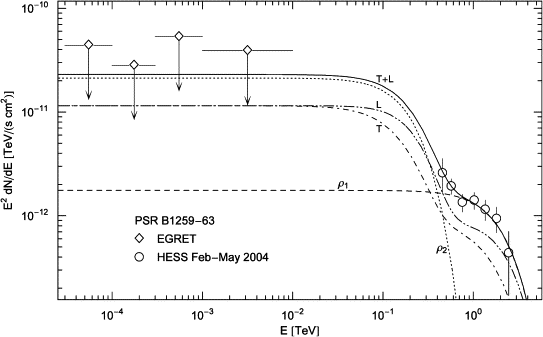
Fig. 5. EGRET plateau and HESS slope of PSR B1259–63. The solid line T+L is the unpolarized tachyon flux dNT+L/dE rescaled with E2 to render the spectral curvature visible. The latter is caused by the Boltzmann factor in the averaged spectral densities (42); the exponential decay of the cascades ρ1,2 sets in at about Ecut≈(mt/m)kT, implying cutoffs at 0.8 TeV for the ρ1-cascade and 80 GeV for ρ2. The unpolarized flux T+L can be split into transversal (dot-dashed) and longitudinal (dot-dot-dashed) components dNT,L/dE, cf. (43). The spectral plateau extends from the ISGRI and OSSE points in the keV range to the first spectral cut at 80 GeV, cf. Fig. 4.
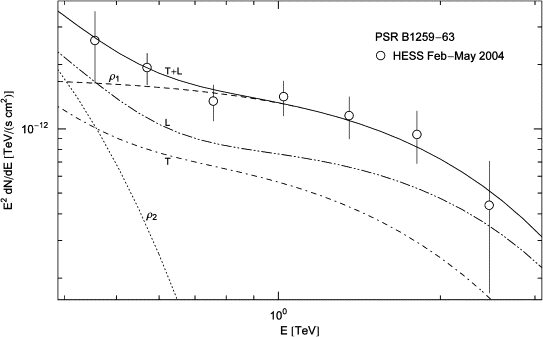
Fig. 6. Close-up of the HESS spectrum of PSR B1259–63 in Fig. 5. The tachyon flux T+L is obtained by adding the cascades ρ1,2. The TeV spectral map coincides with the ρ1-cascade, since the ρ2-flux is exponentially cut at 80 GeV, cf. Fig. 5. Temperature and source number of the electron populations generating the cascades are listed in Table 1.
Thermal electronic source densities ρ1,2 generating the γ-ray broadband of the binary pulsar PSR B1259–63
The cascades ρ1,2
in Fig. 4, Fig. 5 and Fig. 6 are
obtained by averaging the superluminal radiation densities with
electron populations, cf. (42), which are
in turn inferred from the spectral fit. Each distribution is defined by
electron temperature kT and source count ne,
the latter based on a distance estimate of 1.5 kpc. β
is the cutoff parameter in the electronic Boltzmann factor. ![]() is the normalized amplitude of the tachyonic flux density defined in (44). The
parameters
is the normalized amplitude of the tachyonic flux density defined in (44). The
parameters ![]() and β are extracted from the χ2-fit.
and β are extracted from the χ2-fit.
As for the electron count n1,
it is convenient to use a rescaled parameter ![]() for the fit,
for the fit,
 [keV s] implies the tachyon mass in keV units, that is, we put
mt≈2.15
in the spectral density (40). At γ-ray
energies, only a tiny αq/αe-fraction
(the ratio of tachyonic and electric fine structure constants) of the
tachyon flux is actually absorbed by the detector [17], which
requires a rescaling of the electron count n1,
so that the actual number of radiating electrons is
 Fig. 4, Fig. 5 and Fig. 6 show the
least-squares fit to the γ-ray wideband of the
binary system PSR B1259–63/SS 2883, cf. Refs. [18], [19], [20], [21], [22], [23] and [24]. The
extended spectral plateau as well as the spectral curvature over the
entire frequency range can readily be reproduced by a tachyonic cascade
spectrum. (As for the high-magnetic-field pulsar PSR B1509–58, cf. Fig. 1, Fig. 2 and Fig. 3, there
are currently not enough data points available for a spectral fit [14]. A
tachyonic spectral fit to the pulsed Crab flux is given in Ref. [25], where the
spectral asymptotics of the averaged densities and the technical
details of the nonlinear χ2-fit
are discussed as well.) We assume d≈1.5 kpc
as distance to the pulsar, based on optical and scintillation
observations [22], although
it could be as high as 4.5 kpc if inferred from the dispersion measure [23]. In the
latter case, the electronic source count has to be rescaled
accordingly, ![]() ;
the spectral maps are not affected by the distance estimate. The total
flux above 380 GeV is 5% of the unpulsed Crab flux [21]. The
electronic source count for the Crab pulsar at 2 kpc is 2.6×1049,
cf. Ref. [25], as
compared to 3.2×1047
for PSR B1259–63, cf. Table 1.
;
the spectral maps are not affected by the distance estimate. The total
flux above 380 GeV is 5% of the unpulsed Crab flux [21]. The
electronic source count for the Crab pulsar at 2 kpc is 2.6×1049,
cf. Ref. [25], as
compared to 3.2×1047
for PSR B1259–63, cf. Table 1.
Several electromagnetic radiation mechanisms have been invoked to model the spectra of γ-ray pulsars, most notably curvature radiation due to electric fields followed by pair creation, accompanied by synchrotron radiation and inverse Compton scattering [26]. An electromagnetic spectral fit to the γ-ray wideband of the PSR B1259–63/SS 2883 binary was performed in Ref. [20], in the context of a synchro–inverse-Compton model; the tachyonic wideband fit in Fig. 4 is directly comparable to Fig. 16 of this reference. The tachyonic TeV fit in Fig. 6 is directly comparable to the inverse-Compton fit in Fig. 15 of Ref. [24].
5. Conclusion
We have studied superluminal radiation from ultrarelativistic electrons helically orbiting in strong magnetic fields and derived the pitch-angle scaling of the radiation densities. In the zero-magnetic-field limit, the tachyonic synchrotron densities converge to the spectral densities (40) for uniform motion. Orbital curvature induces modulations along the spectral slopes. If integrated over the pitch angles, these oscillations are averaged out, cf. Fig. 1, Fig. 2 and Fig. 3.
We demonstrated that the γ-broadband of the binary pulsar PSR B1259–63 can be reproduced by a tachyonic cascade spectrum, cf. Fig. 4, Fig. 5 and Fig. 6. The cascades are obtained by averaging the radiation densities with thermal electron distributions. At γ-ray energies, the speed of tachyons is close to the speed of light; the basic difference to electromagnetic radiation is the longitudinally polarized flux component. The polarization of tachyons can be determined from transversal and longitudinal ionization cross-sections of Rydberg atoms, which peak at different scattering angles [27].
We have focused on the γ-ray spectrum, including the high end of the X-ray tail. At X-ray energies, if a grating spectrometer is used [28], the interference peaks are determined by wavelength. In this case, the data points have to be reparametrized by wavelength, and then the tachyonic dispersion relation is substituted (which substantially differs from the photonic counterpart due to the 2 keV tachyon mass located in the X-ray regime) to obtain the tachyonic energy-flux relation. Tachyonic spectral fits in the X-ray band will be discussed elsewhere.
Acknowledgements
The author acknowledges the support of the Japan Society for the Promotion of Science. The hospitality and stimulating atmosphere of the Centre for Nonlinear Dynamics, Bharathidasan University, Trichy, and the Institute of Mathematical Sciences, Chennai, are likewise gratefully acknowledged.
References
R. Tomaschitz, Eur. Phys. J. B 17 (2000), p. 523.
K.C. Westfold, Astrophys. J. 130 (1959), p. 241.
R. Tomaschitz, Astropart. Phys. 23 (2005), p. 117.
T.W. Connors et al., Mon. Not. R. Astron. Soc. 336 (2002), p. 1201.


