doi:10.1209/0295-5075/85/29001
Tachyonic γ-ray cascades from BL Lacertae
objects
R. Tomaschitz
Department of Physics, Hiroshima University - 1-3-1 Kagami-yama, Higashi-Hiroshima 739-8526, Japan
E-mail: tom@geminga.org
Received 28 November 2008, accepted for publication 15
December 2008
Published 28 January 2009
| Abstract. Evidence
for
superluminal radiation from TeV blazars is pointed out. Spectral fits
of the BL Lacertae objects W Comae, 1ES 2344 + 514,
PG
1553 + 113, and 1ES 0806 + 524 are
performed with
tachyonic γ-ray cascades generated by the thermal electron plasma in
the galactic nuclei. The transversal and longitudinal radiation
components as well as the thermodynamic parameters of the
ultra-relativistic electron populations are extracted from the spectral
maps based on EGRET, VERITAS, MAGIC, and HESS flux data. An extended
spectral plateau typical for tachyonic γ-ray spectra emerges in the MeV
and low GeV range, terminating in exponential decay without a power law
crossover. Thermal tachyonic cascade spectra are also predicted for
Fermi blazars. By comparing to other TeV γ-ray sources such as Galactic
supernova remnants and pulsar wind nebulae as well as active galactic
nuclei, the curvature in the high-energy spectral slopes of BL Lacertae
objects is shown to be intrinsic, i.e. uncorrelated
with distance.
PACS numbers: 98.54.Cm, 52.27.Ny, 95.30.Gv |
Introduction: Tachyonic spectral densities of ultra-relativistic electrons
We perform a tachyonic cascade fit to a GeV γ-ray flare of the active galactic nucleus W Comae [1, 2], as well as to γ-ray spectra of the TeV blazars 1ES 2344 + 514 [3], PG 1553 + 113 [4], and 1ES 0806 + 524 [5]. In contrast to GeV–TeV photons, the extragalactic tachyon flux is not attenuated by interaction with the cosmic background light. There is no absorption of tachyonic γ-rays via pair creation, as tachyons do not interact with infrared background photons. We show that the curvature in the γ-ray spectra of BL Lacertae objects (BL Lacs) is caused by the Boltzmann factor of the ultra-relativistic electron plasma in the galactic nucleus rather than by intergalactic absorption, in accordance with the tachyonic radiation model.
The quantized tachyonic radiation densities of uniformly moving electrons read [6, 7]
where the superscripts T and L refer to the
transversal/longitudinal polarization components defined by ΔT = 1 − mt2/(2m2)
and ΔL = 0. m
and γ denote the electron mass and the electronic Lorentz factor, mt  2.15 keV
is the tachyon
mass, and αq 1.0 × 10⁻¹³
the tachyonic fine-structure constant estimated from hydrogenic Lamb
shifts [8]. A
spectral cutoff occurs at
2.15 keV
is the tachyon
mass, and αq 1.0 × 10⁻¹³
the tachyonic fine-structure constant estimated from hydrogenic Lamb
shifts [8]. A
spectral cutoff occurs at
Only frequencies in the range 0 ≤ ω ≤ ωmax(γ) can be radiated by a uniformly moving charge [6], and a positive ωmax(γ) requires Lorentz factors exceeding the threshold μt in (2).
Spectral averaging over thermal electron populations
We average the radiation densities (1) with a thermal ultra-relativistic Maxwell-Boltzmann distribution,

The electron number is found via  , which defines the normalization factor A.
The exponential cutoff is related to the electron temperature by
β = m/(kT). The
average is carried out as
, which defines the normalization factor A.
The exponential cutoff is related to the electron temperature by
β = m/(kT). The
average is carried out as

where θ is the Heaviside step function. The spectral range of
the radiation densities (1)
is bounded by ωmax in (2), so that the solution of  defines the minimal electronic Lorentz factor for radiation at this
frequency,
defines the minimal electronic Lorentz factor for radiation at this
frequency,

The average (4) can be reduced to
with the density dρ(γ) given in (3) and the Lorentz factor  in (5). The
superscripts T and L denote the transversal and longitudinal radiation
components. The spectral fits in figs. 1–5
are based on the E2-rescaled
differential flux densities
in (5). The
superscripts T and L denote the transversal and longitudinal radiation
components. The spectral fits in figs. 1–5
are based on the E2-rescaled
differential flux densities

where d is the distance to the source and
 . The
rescaling with E2 is useful,
as it reveals the curvature of rapidly decaying spectral slopes.
. The
rescaling with E2 is useful,
as it reveals the curvature of rapidly decaying spectral slopes.
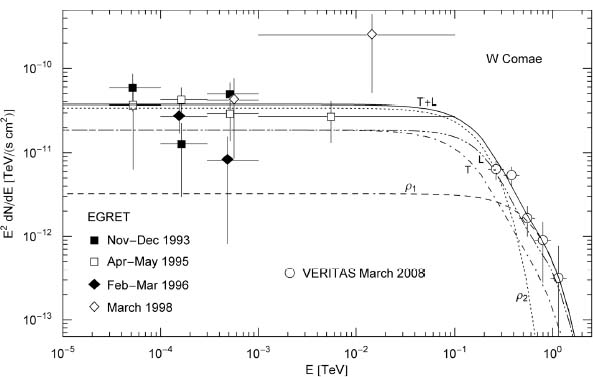
| Figure 1. γ-ray wideband of the BL Lac object W Comae. VERITAS flux points from ref. [9], EGRET points refer to the associated source 3EG J1222 + 2841, cf. ref. [11]. The solid line T + L depicts the unpolarized differential tachyon flux dNT+L/dE, obtained by adding the flux densities ρ1,2 of two ultra-relativistic electron populations, cf. table 1. The transversal and longitudinal flux densities dNT,L/dE add up to the total unpolarized flux T + L, cf. (7). The EGRET flux points define a spectral plateau in the MeV to GeV range typical for tachyonic cascade spectra [6, 13, 19]. |
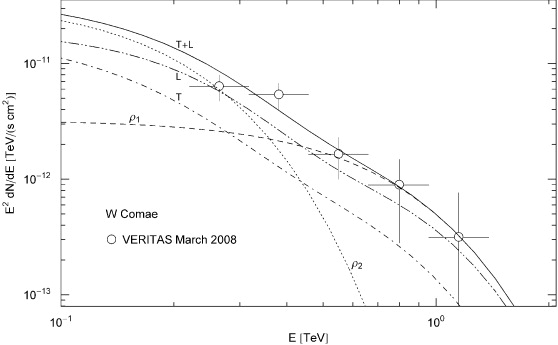
| Figure 2.
Close-up of the VERITAS flare spectrum in fig. 1. T and L stand for the
transversal and longitudinal flux components, and
T + L = ρ1 + ρ2
labels the unpolarized flux. The exponential decay of the cascades ρ1,2
sets in at about Ecut (mt/m) kT,
where mt/m 1/238 is the
tachyon-electron
mass ratio [8],
implying cutoff energies of 240 GeV for the ρ1
cascade and 67 GeV for ρ2. |
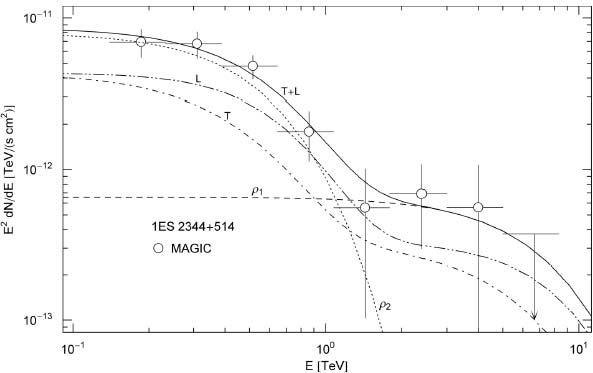
| Figure 3. Spectral map of the TeV blazar 1ES 2344 + 514. MAGIC data points from ref. [3], notation as in figs. 1 and 2. The cutoff energy is 2.8 TeV for the ρ1 cascade and 220 GeV for ρ2. The spectral curvature of the rescaled flux density E2dNT+L/dE is generated by the Boltzmann factor of the thermal electron populations, cf. (3) and table 1. |
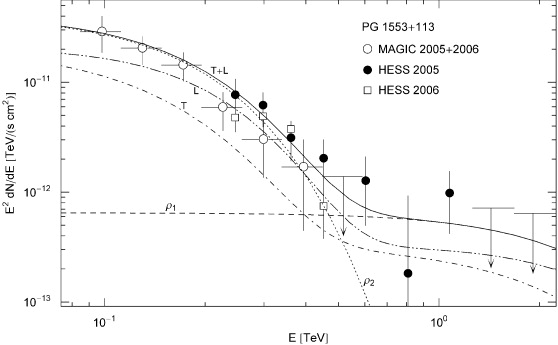
| Figure 4. Spectral map of the BL Lac object PG 1553 + 113. MAGIC flux points from ref. [14], HESS points from ref. [15]. The plots are labeled as in fig. 1. The ρ2 cascade is cut at 65 GeV, the cutoff of the high-energy cascade ρ1 is at about 1 TeV. The spectral curvature is comparable to that of the BL Lac 1ES 2344 + 514 in fig. 3, despite the higher redshift of PG 1553 + 113, cf. table 1, suggesting that the curvature of the plotted flux density is intrinsic rather than due to intergalactic absorption. |
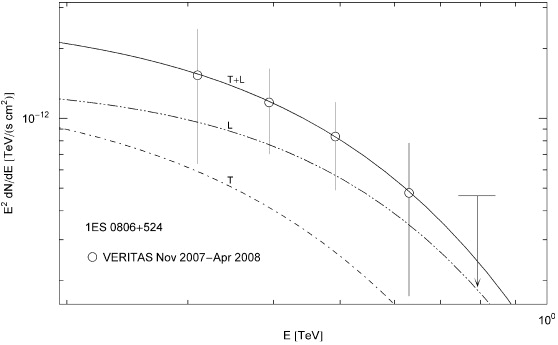
| Figure 5. Spectral map of the BL Lac object 1ES 0806 + 524. VERITAS flux points from ref. [5]. There is only one cascade T + L = ρ1 in the depicted 0.2–1 TeV interval. The spectral cutoff occurs at 160 GeV. One may compare the spectral slope to the high-energy slope of quasar 3C 279 in fig. 2 of ref. [19], whose redshift is almost four times that of 1ES 0806 + 524, although the spectral curvature is quite similar. Conversely, the BL Lac H1426 + 428 has a similar redshift, but its spectral curvature is less pronounced, cf. fig. 3 of ref. [6]. The spectral curvature is thus uncorrelated with redshift. |
Tachyonic cascade fits of TeV blazars
In fig. 1, a γ-ray flare of W Comae (W Com, ON 231) observed with the imaging atmospheric Cherenkov telescope VERITAS in March 2008 [9] is studied in association with the unidentified EGRET source 3EG J1222 + 2841 [10]. The MeV to GeV flux points of the γ-ray wideband in fig. 1 were recorded with the EGRET instrument on board the Compton Gamma Ray Observatory during four viewing periods in 1993-1998 [11]. The spectral fit is shown in figs. 1 and 2; the tachyonic cascades ρi are plots of the rescaled flux densities (7). The fit is performed with the unpolarized flux dNT+L/dE = dNT/dE + dNL/dE generated by thermal electron populations ρi, cf. (3) and table 1. Each electron density generates a cascade ρi, and the wideband comprises two cascade spectra.
Table 1.
Electronic source distributions ρi
generating the tachyonic γ-ray spectra of the BL Lac objects in
figs. 1–5. ρ1,2
denote thermal ultra-relativistic Maxwell-Boltzmann densities (3) with cutoff parameter β in
the Boltzmann factor.  determines the
amplitude of the tachyon flux generated by the electron density ρi.
The electron count ne is
calculated at the indicated distance d estimated
from the quoted redshift, cf. after (8).
kT is the temperature and U
the internal energy of the thermal electron populations ρi,
cf. (9). The
distance estimates do not affect the spectral maps but the electron
number ne.
Regarding blazar PG 1553 + 113, the electron count
and
internal energy are listed for two different redshift
estimates [4, 16]. The tachyonic γ-ray
cascades labeled ρ1,2
in the figures are produced by the corresponding electronic source
distributions in this table. Each cascade depends on two fitting
parameters β and determines the
amplitude of the tachyon flux generated by the electron density ρi.
The electron count ne is
calculated at the indicated distance d estimated
from the quoted redshift, cf. after (8).
kT is the temperature and U
the internal energy of the thermal electron populations ρi,
cf. (9). The
distance estimates do not affect the spectral maps but the electron
number ne.
Regarding blazar PG 1553 + 113, the electron count
and
internal energy are listed for two different redshift
estimates [4, 16]. The tachyonic γ-ray
cascades labeled ρ1,2
in the figures are produced by the corresponding electronic source
distributions in this table. Each cascade depends on two fitting
parameters β and  , cf. (3) and (8), extracted from the χ2
fit T + L in the figures. , cf. (3) and (8), extracted from the χ2
fit T + L in the figures. |
| β |  |
d (Mpc) | ne | kT (TeV) | U (1060 TeV) | |
| W Comae | ||||||
| ρ1 | 8.78 × 10⁻⁹ | 3.5 × 10⁻⁴ | z 0.102 |
4.1 × 1057 | 58.2 | 0.71 |
| ρ2 | 3.16 × 10⁻⁸ | 3.7 × 10⁻³ | 450 | 4.3 × 1058 | 16.2 | 2.1 |
| 1ES 2344 + 514 | ||||||
| ρ1 | 7.68 × 10⁻¹⁰ | 7.1 × 10⁻⁵ | z 0.044 |
1.5 × 1056 | 665 | 0.30 |
| ρ2 | 9.77 × 10⁻⁹ | 8.6 × 10⁻⁴ | 190 | 1.85 × 1057 | 52.3 | 0.29 |
| PG 1553 + 113 | ||||||
| ρ1 | 2.15 × 10⁻⁹ | 7.0 × 10⁻⁵ | z 0.36 |
1.0 × 1058 | 238 | 7.1 |
| ρ2 | 3.31 × 10⁻⁸ | 4.4 × 10⁻³ | 1600 | 6.5 × 1059 | 15.4 | 30 |
| ρ1 | 2.15 × 10⁻⁹ | 7.0 × 10⁻⁵ | z 0.1 |
7.8 × 1056 | 238 | 0.56 |
| ρ2 | 3.31 × 10⁻⁸ | 4.4 × 10⁻³ | 440 | 4.9 × 1058 | 15.4 | 2.3 |
| 1ES 0806 + 524 | z 0.138 |
|||||
| ρ1 | 1.33 × 10⁻⁸ | 3.0 × 10⁻⁴ | 610 | 6.4 × 1057 | 38.4 | 0.74 |
The spectral plateau in fig. 1 (extending over the MeV
range to low GeV energies) and the curved spectral slope defined by the
VERITAS points in fig. 2
are reproduced by the cascade fit. As for the electronic source number,
cf. after (3),
we use a rescaled parameter  for the fit,

which is independent of the distance estimate in (7). Here, ![\hbar\, [{\rm keV}\, {\rm s}]](FT_tachyonic_gamma-ray_cascades_BL_Lacertae_objects_files/epl11542ieqn9.gif) implies the tachyon mass in keV units in the spectral functions BT,L
in (6). At
γ-ray energies, only a tiny αq/αe
fraction (the ratio of tachyonic and electric fine-structure constants)
of the tachyon flux is absorbed by the detector, which requires a
rescaling of the electron number n1,
so that the actual number of radiating electrons is ne = n1αe/αq 7.3 × 10¹⁰n1,
cf. ref. [12]. We
thus find the electron count as
implies the tachyon mass in keV units in the spectral functions BT,L
in (6). At
γ-ray energies, only a tiny αq/αe
fraction (the ratio of tachyonic and electric fine-structure constants)
of the tachyon flux is absorbed by the detector, which requires a
rescaling of the electron number n1,
so that the actual number of radiating electrons is ne = n1αe/αq 7.3 × 10¹⁰n1,
cf. ref. [12]. We
thus find the electron count as ![n^{\rm e} \approx 5.75\times 10^{55}\hat{n}d^2\, [{\rm Mpc}]](FT_tachyonic_gamma-ray_cascades_BL_Lacertae_objects_files/epl11542ieqn10.gif) , where
, where  determines the
tachyonic flux amplitude extracted from the χ2
fit. The redshift z 0.102 of W
Com translates into a
distance of 450 Mpc via d [Mpc] 4.4 × 10³z,
that is d ~ cz/H0,
with h0 0.68.
determines the
tachyonic flux amplitude extracted from the χ2
fit. The redshift z 0.102 of W
Com translates into a
distance of 450 Mpc via d [Mpc] 4.4 × 10³z,
that is d ~ cz/H0,
with h0 0.68.
The cutoff energy of the thermal cascades depends on the
electron temperature kT [TeV] 5.11 × 10⁻⁷/β,
cf. the caption of fig. 2.
The energy estimates of the electronic source populations in
table 1 are
based on U [TeV] ~ 1.53 × 10⁻⁶ne/β,
which is the high-temperature limit of the internal energy of a
relativistic Fermi gas,

This expansion is valid for β = m/kT  1, and the second
term in the
parentheses has to be small compared to 1. We may combine these two
conditions as TF/T 1, where
1, and the second
term in the
parentheses has to be small compared to 1. We may combine these two
conditions as TF/T 1, where  is the relativistic Fermi energy with pF = (3π2ne/V)1/3.
Equation (9) is
derived from the high-temperature fugacity expansion of a Fermi
distribution, of which the classical density (3) is the leading order, cf. e.g.
ref. [13].
is the relativistic Fermi energy with pF = (3π2ne/V)1/3.
Equation (9) is
derived from the high-temperature fugacity expansion of a Fermi
distribution, of which the classical density (3) is the leading order, cf. e.g.
ref. [13].
The tachyonic spectral fit of blazar 1ES
2344 + 514 (z 0.044) [3] is depicted in fig. 3, and that of blazar PG
1553 + 113 [14,
15] in fig. 4.
The flux points were collected with the air Cherenkov detectors MAGIC
and HESS. The redshift of PG 1553 + 113 is still
unclear due
to its featureless spectrum; the estimate of z 0.36 is based
on a contested
absorption line [4],
a lower bound of z > 0.09
is given in ref. [16].
The spectral map is not affected by the distance estimate, but the
source number and internal energy of the electron populations are. We
therefore list these quantities in table 1 for z 0.1 as well
as z 0.36. The
cascade fit of the BL
Lac 1ES 0806 + 524 at z 0.138 [17] is shown in fig. 5.
High-energy spectral slopes of Galactic TeV γ-ray sources and active galactic nuclei: a comparative study
High-energy γ-ray spectra of active galactic nuclei (AGNs) are
usually assumed to be generated by inverse Compton scattering or pp
scattering followed by π0 decay [9, 14].
Both mechanisms result in a flux of high-energy photons partially
absorbed by interaction with the infrared background radiation. By
contrast, there is no absorption of tachyonic γ-rays, since tachyons
cannot directly interact with photons. We may compare figs. 2–5
to the spectral maps of the AGNs H1426 + 428 (z 0.129,
570 Mpc) and
1ES 1959 + 650 (z 0.047,
210 Mpc) in
ref. [6],
1ES 0229 + 200 (z 0.140,
620 Mpc) in
ref. [18], and
the radio quasar 3C 279 (z 0.538,
2.4 Gpc) in
ref. [19].
The curvature of these spectra is uncorrelated with distance. For
instance, there is no increase of the spectral curvature with redshift
that could indicate absorption, when comparing the blazar 1ES
0347 − 121 (z 0.188,
830 Mpc) in fig.
2 of ref. [18] to
the BL Lac 1ES 2344 + 514 (z 0.044,
190 Mpc) in
fig. 3. The
nearer source has even steeper spectral slopes.
Moreover, the spectral maps of some Galactic TeV sources look quite similar to those of AGNs, which likewise indicates unattenuated intergalactic propagation of TeV γ-rays. The spectral maps of the Markarian galaxies Mkn 501 (at 150 Mpc) and Mkn 421 (140 Mpc) in figs. 5 and 6 of ref. [6] are to be compared to the Galactic TeV sources HESS J1303 − 631 in fig. 3 and HESS J1825 − 137 in fig. 5 of ref. [7], as well as to the microquasar LS 5039 in fig. 2 of ref. [12]. The curved spectral slopes of the Galactic sources are steeper than of the AGNs. Therefore, absorption of electromagnetic radiation due to interaction with background photons is not a viable explanation of spectral curvature, since the curvature would increase with distance if affected by intergalactic absorption. In fact, photonic attenuation theories have constantly overestimated the attenuation, owing to intricate modeling with vaguely known cosmological input parameters, which come on top of the fitting parameters of the inverse-Compton or hadronic radiation models. An electromagnetic spectral fit of BL Lac 1ES 2344 + 514 is depicted in fig. 6 of ref. [3], which can be compared to the tachyonic counterpart in fig. 3.
The common feature in the γ-ray wideband of TeV blazars is the extended MeV-to-GeV spectral plateau, cf. fig. 1. The low-energy cascades in figs. 3–5 also extend further into the GeV band as spectral plateaus, but only the decaying slopes are depicted, owing to the lack of data points in the lower GeV range to compare with. One may thus predict Fermi blazars to exhibit a spectral plateau in the E2-rescaled flux representation used in the figures, since Fermi flux points are unlikely to significantly differ from EGRET observations, apart from the error bars. In the high GeV region, the plateaus will bend into exponential decay, notably without a power law transition, cf. the discussion below. In brief, the spectral maps of Fermi blazars combined with Cherenkov observations will be structured like the γ-ray broadband of W Com in fig. 1.
Conclusion
Tachyonic γ-ray spectra of TeV blazars are generated by thermal ultra-relativistic electron populations in the galactic nuclei. Tachyons are radiation modes, unrelated to electromagnetic radiation. The tachyon mass refers to the radiation field rather than the current [20], in contrast to the traditional approach based on a current of superluminal source particles emitting electromagnetic radiation [21–25]. The tachyonic radiation modes are coupled by minimal substitution to the electron current. The negative mass-square of tachyons implies superluminal velocity and allows longitudinal polarization [19]. The tachyonic radiation field does not couple to electromagnetic fields, nor is it affected by electric charge. Interaction of tachyons with photons can only happen indirectly via matter fields. Thus, in contrast to electromagnetic γ-rays, there is no extinction of the extragalactic tachyon flux by the cosmic background light.
The cascade spectra in figs. 1–5 are produced by the tachyonic radiation density averaged over the electron populations of the AGNs, cf. (6). The radiation density (1) is generated by electrons in uniform motion [26]; there is no radiation damping, as photons can only be radiated by accelerated charges, in contrast to tachyonic quanta, where the emission rate primarily depends on the electronic Lorentz factor rather than on acceleration [27, 28]. Superluminal synchrotron radiation from ultra-relativistic electrons orbiting in magnetic fields was investigated in ref. [29]. In the zero-magnetic-field limit, the averaged tachyonic synchrotron densities converge to the densities (1). The orbital curvature induces modulations in the high-energy slope of these densities, but the ripples are smoothed out when performing a pitch-angle average, cf. figs. 1–3 of ref. [29]. Thus we can use uniform radiation densities even in the presence of magnetic fields in the galactic nuclei. In this case, if the trajectories are bent by magnetic fields, there are radiation losses due to the electromagnetic curvature radiation. In the absence of sizeable magnetic fields and other scattering mechanisms, high Lorentz factors and temperatures are sustainable owing to the lack of radiation damping, the superluminal radiation being generated by inertial electrons. The high plasma temperature inferred from the spectral fits, cf. table 1, implies ultra-high energy electrons in the AGNs. Such high electron temperatures are also found in Galactic pulsar wind nebulae, possible production sites of ultra-high–energy cosmic rays [7, 30, 31].
The γ-ray cascades of TeV blazars are radiated by thermal
electron populations depending on two fitting parameters, the electron
number and temperature [6,
32].
By contrast, the shock-heated electron plasma of supernova remnants
requires a nonthermal fit with the electron index δ as third parameter,
so that the density (3)
is replaced by  in the Boltzmann average (6).
A non-zero δ can result in a power law slope joining the
spectral
plateau to the curved exponentially decaying slope, cf. the
spectral maps of the supernova remnants W28 in fig. 4 of
ref. [18] and
RX J1713.7 − 3946 in fig. 2 of
ref. [6] as well
as the cascade fits of the Galactic TeV sources in refs. [31, 33].
Here, we have demonstrated that the thermal (δ = 0)
γ-ray
cascades of BL Lac objects are exponentially cut without power-law
crossover, and that the exponential decay manifested in the curved
spectral slopes in figs. 1–5
is solely caused by the Boltzmann factor of the electron densities, as
tachyonic γ-rays propagate unattenuated over intergalactic distances.
in the Boltzmann average (6).
A non-zero δ can result in a power law slope joining the
spectral
plateau to the curved exponentially decaying slope, cf. the
spectral maps of the supernova remnants W28 in fig. 4 of
ref. [18] and
RX J1713.7 − 3946 in fig. 2 of
ref. [6] as well
as the cascade fits of the Galactic TeV sources in refs. [31, 33].
Here, we have demonstrated that the thermal (δ = 0)
γ-ray
cascades of BL Lac objects are exponentially cut without power-law
crossover, and that the exponential decay manifested in the curved
spectral slopes in figs. 1–5
is solely caused by the Boltzmann factor of the electron densities, as
tachyonic γ-rays propagate unattenuated over intergalactic distances.
References
- [1]
- Tagliaferri C. et al 2000 Astron. Astrophys. 354 431
- [2]
- Scalzo R. A. et al 2004 Astrophys. J. 607 778
- [3]
- Albert J. et al 2007 Astrophys. J. 662 892
- [4]
- Osterman M. A. et al 2006 Astron. J. 132 873
- [5]
- Acciari V. A. et al 2009 Astrophys. J. 690 L126
- [6]
- Tomaschitz R. 2007 Eur. Phys. J. C 49 815
- [7]
- Tomaschitz R. 2007 Ann. Phys. (N.Y.) 322 677
- [8]
- Tomaschitz R. 2000 Eur. Phys. J. B 17 523
- [9]
- Acciari V. A. et al 2008 Astrophys. J. 684 L73
- [10]
- Hartman R. C. et al 1999 Astrophys. J. Suppl. 123 79
- [11]
- Böttcher M., Mukherjee R. and Reimer A. 2002 Astrophys. J. 581 143
- [12]
- Tomaschitz R. 2007 Physica A 385 558
- [13]
- Tomaschitz R. 2008 Physica A 387 3480
- [14]
- Albert J. et al 2007 Astrophys. J. 654 L119
- [15]
- Aharonian F. et al 2008 Astron. Astrophys. 477 481
- [16]
- Sbarufatti B. et al 2006 Astron. J. 132 1
- [17]
- Nilsson K. et al 2007 Astron. Astrophys. 475 199
- [18]
- Tomaschitz R. 2008 Phys. Lett. A 372 4344
- [19]
- Tomaschitz R. 2008 EPL 84 19001
- [20]
- Tomaschitz R. 2005 Eur. Phys. J. D 32 241
- [21]
- Sommerfeld A. 1904 Proc. K. Akad. Wet. Amsterdam, Sect. Sci. 7 346
- [22]
- Tanaka S. 1960 Prog. Theor. Phys. 24 171
- [23]
- Terletsky Ya. P. 1961 Sov. Phys. Dokl. 5 782
- [24]
- Feinberg G. 1967 Phys. Rev. 159 1089
- [25]
- Newton R. 1970 Science 167 1569
- [26]
- Tomaschitz R. 2003 Physica A 320 329
- [27]
- Wheeler J. A. and Feynman R. P. 1945 Rev. Mod. Phys. 17 157
- [28]
- Tomaschitz R. 2001 Class. Quantum Grav. 18 4395
- [29]
- Tomaschitz R. 2007 Phys. Lett. A 366 289
- [30]
- Nagano M. and Watson A. A. 2000 Rev. Mod. Phys. 72 689
- [31]
- Tomaschitz R. to be published in Physica B (2008) doi: 10.1016/j.physb.2008.12.026
- [32]
- Tomaschitz R. to be published in Opt. Commun. (2009) doi: 10.1016/j.optcom.2009.01.024
- [33]
- Tomaschitz R. 2007 Astropart. Phys. 27 92