Volume 282, Issue 9, 1 May 2009, Pages 1710-1719
Roman
Tomaschitz ,
a,
,
a,

Abstract
The diffraction of superluminal radiation fields in crystal lattices is studied. The negative mass-square of the tachyonic wave modes affects the modulation function of diffraction gratings and the scattering amplitude. The Bragg condition for tachyon diffraction as well as the longitudinal and transversal cross sections are derived. Scalar and vectorial Kirchhoff identities for superluminal Proca fields are obtained from Sommerfeld’s dipole functionals, in analogy to electromagnetic theory. These surface-integral representations of the tachyon potential and the tachyonic field strengths are used to calculate the asymptotic diffracted modes and the intensity ratios. The dependence of the primary and secondary intensity peaks on the tachyon mass is analyzed in the reciprocal lattice, and the conversion of transversal into longitudinal radiation by way of Bragg scattering is explained. Specifically, tachyonic spectral fits are performed to the TeV spectra of three active galactic nuclei, H2356 − 309, 1ES 1218 + 304, and 1ES 1101 − 232, obtained with the imaging atmospheric Cherenkov detectors HESS, MAGIC, and VERITAS. The curvature in the spectral maps of these blazars is shown to be intrinsic, generated by ultra-relativistic electron populations in the galactic nuclei rather than by intergalactic absorption, and is reproduced by a tachyonic cascade fit.
Keywords: Tachyon diffraction; Transversal and longitudinal polarization; Green’s function for superluminal wave propagation; Tachyonic Maxwell equations and Fraunhofer far-field approximation; Cross sections and intensity ratios of tachyonic Bragg scattering; Superluminal cascade spectra of TeV blazars
PACS classification codes: 42.25.Fx; 42.25.Ja; 61.05.cc; 95.30.Gv
Article Outline
- 1. Introduction
- 2. Superluminal radiation fields
- 2.1. Proca equation with negative mass-square
- 2.2. Tachyonic dipole fields
- 2.3. Kirchhoff representation of the tachyon potential and the field strengths
- 3. Fraunhofer diffraction of superluminal radiation at a plane aperture
- 3.1. Tachyonic energy flux
- 3.2. Polarized superluminal modes: conversion of transversal into longitudinal tachyons by diffraction
- 3.3. Intensity ratios for the conversion of longitudinal into transversal radiation
- 4. Tachyonic Bragg scattering
- 4.1. Diffraction gratings: negative mass-square and Bragg condition
- 4.2. Tachyon diffraction in crystal lattices: transversal and longitudinal scattering cross sections
- 5. Tachyonic flare spectra of TeV blazars
- 6. Conclusion: tachyonic X-rays and Bragg spectrometers
- Acknowledgements
- References
1. Introduction
We investigate the diffraction of superluminal wave modes, outlining a theory of tachyon diffraction based on Kirchhoff’s surface-integral representation of Proca fields. We work out two specific examples, diffraction at plane apertures such as diffraction gratings, and tachyonic Bragg scattering in crystal lattices. The formalism is developed in close analogy to electromagnetic diffraction theory, even though there are substantial differences owing to the negative mass-square of tachyons [1], [2], [3], [4] and [5] and the occurrence of longitudinally polarized modes [6], [7] and [8].The negative mass-square refers to the radiation rather than the source. This in strong contrast to the traditional approach based on superluminal source particles emitting electromagnetic radiation [9]. The tachyonic radiation discussed here implies superluminal energy transfer, the radiation quanta moving faster than light, in contrast to the rotating superluminal light sources studied in Refs. [10], [11] and [12] and the vacuum Cherenkov radiation suggested in [13], [14], [15] and [16]. Tachyons are radiation modes, a kind of photons with negative mass-square, coupled by minimal substitution to the electron current, cf. Section 2. The tachyonic Maxwell equations admit a static potential analogous to the Coulomb potential, but oscillating because of the negative mass-square, and much weaker due to the small tachyonic fine structure constant [17]. Photons can only be radiated by accelerated charges, in contrast to tachyonic quanta, where the emission rate primarily depends on the electronic Lorentz factor rather than on acceleration [18]. Here, we investigate how the intensity peaks and scattering cross sections are affected by the tachyon mass, and study the effect of diffraction on the polarization of superluminal modes. We disentangle the transversal and longitudinal polarization components in the spectral maps of the BL Lacertae objects H2356 − 309, 1ES 1218 + 304, and 1ES 1101 − 232, and show that the TeV spectra of these blazars can be fitted with tachyonic cascades radiated by the thermal electron plasma in the active galactic nuclei. In the spectral maps, the tachyon–electron mass ratio enters in the cutoff energy of the cascades.
In Section 2, we discuss the tachyonic Maxwell equations in Fourier space, including the material equations relating tachyonic inductions and field strengths. We calculate the superluminal radiation fields generated by dipole currents, and introduce dipole functionals to derive the Kirchhoff identities for the scalar and vector potentials as well as the tachyonic field strengths. In Section 3, we study tachyon diffraction at a plane aperture, calculate the asymptotic diffracted wave modes in the far-field regime, and assemble the intensity ratios determining the conversion efficiency from transversal to longitudinal radiation and vice versa. In Section 4, we consider the specific case of a grating aperture, and calculate the modulation function, from which the intensity peaks of the diffracted superluminal wave fields can be read off. We discuss Bragg diffraction of tachyons in crystal lattices, in particular the effect of the negative mass-square on the transversal and longitudinal scattering cross sections. In Section 5, we perform tachyonic cascade fits to blazar spectra, separate the transversal and longitudinal flux components, and derive estimates of the electronic source populations in the active galactic nuclei. In Section 6, we present our conclusions with regard to tachyonic X-ray spectra obtained with Bragg gratings.
2. Superluminal radiation fields
2.1. Proca equation with negative mass-square
The tachyonic radiation field in vacuum is a real vector field
with negative mass-square, satisfying the Proca equation ![]() ,
subject to the Lorentz condition Aμ,μ=0
[6]. mt
is the mass of the superluminal Proca field Aμ,
and q the tachyonic charge carried by the
subluminal electron current jμ = (ρ, j).
In the Proca equation, the mass term is added with a positive sign, and
the sign convention for the metric defining the d’Alembertian ∂ν∂ν
is diag(−1, 1, 1, 1), so that
,
subject to the Lorentz condition Aμ,μ=0
[6]. mt
is the mass of the superluminal Proca field Aμ,
and q the tachyonic charge carried by the
subluminal electron current jμ = (ρ, j).
In the Proca equation, the mass term is added with a positive sign, and
the sign convention for the metric defining the d’Alembertian ∂ν∂ν
is diag(−1, 1, 1, 1), so that ![]() is the negative mass-square of the radiation field. The 3D version of
Proca’s equation is a set of Maxwell equations,
is the negative mass-square of the radiation field. The 3D version of
Proca’s equation is a set of Maxwell equations,
 A0 − ∂A/∂t
and B = rot A.
The Lorentz condition, div A − ∂A0/∂t = 0,
follows from the field equations and current conservation, div j + ∂ρ/∂t = 0.
In a permeable medium, the potential and field strengths in
the inhomogeneous vacuum equations are replaced by inductions, (A0, A) → (C0, C),
(E, B) → (D, H),
defined by material equations [19], [20] and [21]. We will
mostly consider monochromatic waves, ![]() ,
and analogously for the scalar potential A0,
the current, charge density, field strengths, and inductions. Fourier
amplitudes are denoted by a hat. The tachyonic Maxwell equations (2.1) read in
Fourier space as
,
and analogously for the scalar potential A0,
the current, charge density, field strengths, and inductions. Fourier
amplitudes are denoted by a hat. The tachyonic Maxwell equations (2.1) read in
Fourier space as
The inductive potentials
2.2. Tachyonic dipole fields
We substitute the potential representation of the field
strengths into the inhomogeneous field equations in (2.2), and make
use of the Lorentz condition to find
We consider real ε, μ, and a positive k2; the permeabilities may even be negative [23], but then we restrict to a frequency range with positive squared wave numbers. The Green function inverting the wave equations (2.4) is
Here, Re k > 0, so that G(x, x0; ω) gives retarded solutions,
We will exclusively use the whole-space Green function (2.7), symmetric with respect to the first and second argument.
The field strengths are found via the potential representation
stated after (2.3). We define
the bivector
The gradient
 refers to x, but we may
replace
  G → −
G → − ′G, where the prime indicates x′
differentiation. The d3x′
integration extends over the whole space. G
satisfies the radiation condition r(ik − n
 )G = G,
and G=O(1/r),
with r=|x − x′|
and n = (x − x′)/r.
We consider a dipole current and the corresponding charge
density,
 → −
→ − 0, where
  0 is the x0
gradient. The corresponding scalar and vector potentials are
0 is the x0
gradient. The corresponding scalar and vector potentials areThe
and the magnetic counterpart reads
(The dipole vector p is independent of x.) By making use of wave equation (2.6) for G(x, x0; ω), we write the dipole field
The substitutions
 → −
→ − 0 and
rot → −rot0 can be performed
whenever convenient; the subscript zero denotes differentiation with
respect to argument x0 in
the Green function. We write
 2.3. Kirchhoff representation of the tachyon potential and the field strengths
We denote the singular dipole current (2.12) and the
dipole fields (2.13), (2.14), (2.15) and (2.16) by a
subscript δ, e.g. ![]() and
and ![]() ,
and consider a closed surface S around the dipole
at x0. An independent second
set of fields,
,
and consider a closed surface S around the dipole
at x0. An independent second
set of fields, ![]() ,
and
,
and ![]() ,
solves the free tachyonic Maxwell equations (2.2) inside the
cavity defined by S. (These fields are supposed to
be generated by a current distribution outside the enclosure S,
but we will only be concerned with the fields in the interior.) We
define the flux functional [24] and [25]
,
solves the free tachyonic Maxwell equations (2.2) inside the
cavity defined by S. (These fields are supposed to
be generated by a current distribution outside the enclosure S,
but we will only be concerned with the fields in the interior.) We
define the flux functional [24] and [25]
Here, n(x′),
 → −
→ − 0 and
rot → −rot0 are performed in
the dipole fields. Finally, we write x for x0
(an arbitrary point inside the cavity), and drop the scalar
multiplication with the arbitrary dipole vector p,
to obtain the surface-integral representation
0 and
rot → −rot0 are performed in
the dipole fields. Finally, we write x for x0
(an arbitrary point inside the cavity), and drop the scalar
multiplication with the arbitrary dipole vector p,
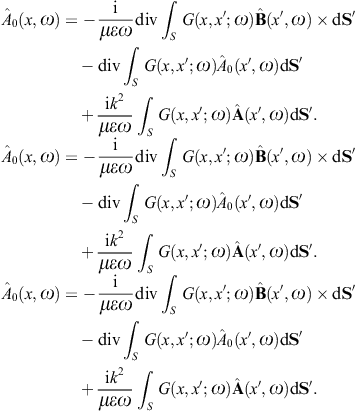
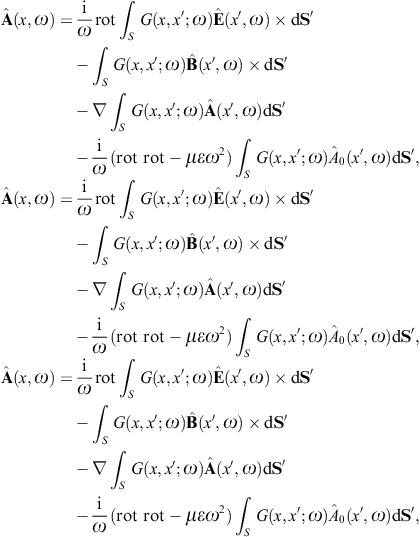
to obtain the surface-integral representationHere, dS′ = n(x′)dS′, where n(x′) is the unit normal vector pointing into the interior of the cavity, and the integration dS′ is over the closed boundary surface S. The field strengths and potentials satisfy the free field equations (2.2) and (2.3) (with ε0 = ε and μ0 = μ) inside the cavity, that is, with zero current and charge density. G(x, x′;ω) is the Green function (2.7), where x ranges inside the cavity, and the integration is over the surface variable x′. The rotor and gradient refer to x. The potentials
 div), cf. (2.16).
We use ![]() to obtain the Kirchhoff identity for the scalar potential,
to obtain the Kirchhoff identity for the scalar potential,
 refer to variable x in the
Green’s function. The Kirchhoff identity for the vector potential is
found by means of
 where we may substitute
 ω2).
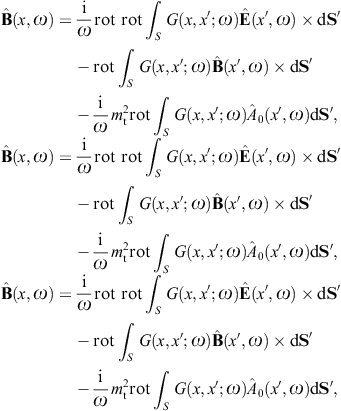
The analogous surface-integral representation of the magnetic field is
obtained via
 where rot rot = (k2 +
 div). These identities follow
from the electric field strength (2.19), by
applying the field equations or potential representation, without
actually solving differential equations. We also note that the Green
function in these identities is the whole-space Green function (2.7), and is
not required to satisfy any particular boundary conditions on the
closed surface S, for technical simplicity.
Therefore, these identities are only valid for solutions of the field
equations, so that the boundary values cannot be arbitrarily
prescribed. In the next section, however, we will prescribe boundary
conditions, and convince ourselves that the fields calculated by means
of the above Kirchhoff identities are asymptotic solutions of the free
tachyonic Maxwell equations (2.2). This is
in fact the practical use of these identities: Even though they will
not give exact solutions for arbitrary boundary values, the resulting
fields may well be approximate solutions in the far-field regime, which
has to be checked on a case-by-case basis, by substitution into the
field equations.
3. Fraunhofer diffraction of superluminal radiation at a plane aperture
3.1. Tachyonic energy flux
As in Section 2.2, we put ε0 = ε
and μ0 = μ.
When studying diffraction in the far-field limit [26] and [27], it
suffices to use the dipole approximation |x − x′|  r(1 − nx′/r),
where r = |x|
and n = x/r,
so that (for large r and |x′| = O(1))
To find the energy flux carried by polarized superluminal
modes incident upon the aperture, we use a plane-wave ansatz in the
tachyonic Maxwell equations (2.2) (with
vanishing charge and current, as well as ε0 = ε
and μ0 = μ),
![]() ,
and analogously for the scalar potential and the field strengths. Here,
k = k(ω)k0,
where k is the wave number in the Green function (2.7), and k0
a constant unit vector. The transversality condition is
,
and analogously for the scalar potential and the field strengths. Here,
k = k(ω)k0,
where k is the wave number in the Green function (2.7), and k0
a constant unit vector. The transversality condition is ![]() ,
and the set of transversal modes reads
,
and the set of transversal modes reads
We substitute these plane-wave solutions into the tachyonic Poynting vector
Here, real permeabilities and a positive wave number k(ω) are implied.
3.2. Polarized superluminal modes: conversion of transversal into longitudinal tachyons by diffraction
We consider an incident transversal plane wave, propagating in
the lower half-space toward the aperture A in the (x, y)
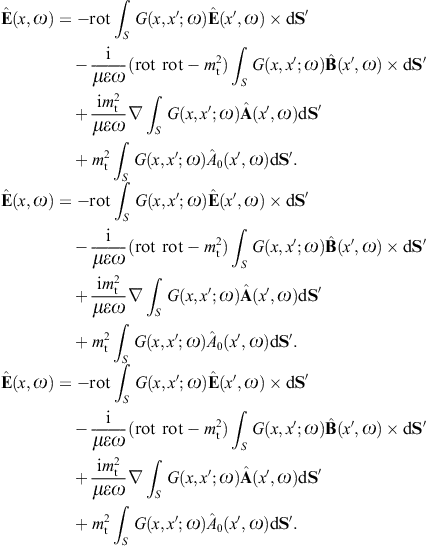
plane. The Fourier amplitude of the vector potential is ![]() ,
cf. (3.2). By making
use of the Kirchhoff identity (2.19) and the
limit procedure outlined after (3.1), we find
the leading asymptotic order (r → ∞,
Fraunhofer regime [29]) of the
diffracted wave in the upper half-space as
,
cf. (3.2). By making
use of the Kirchhoff identity (2.19) and the
limit procedure outlined after (3.1), we find
the leading asymptotic order (r → ∞,
Fraunhofer regime [29]) of the
diffracted wave in the upper half-space as
where x′ = (x′, y′, z′ = 0) [20]. The scalar potential reads, cf. (2.20),
and the vector potential, cf. (2.21),
The magnetic field strength is found as, cf. (2.22),
When calculating the intensity of the diffracted superluminal flux, we need the transversal and longitudinal projections of the vector potential, that is
As for the outgoing transversal polarization vectors εj
of the diffracted wave in the upper half-space, we choose two real
vectors ε1,2
orthogonal to n, so that ε1
lies in the plane generated by n and the
incident unit wave vector k0,
The longitudinal polarization vectors of the in- and outgoing waves are the unit wave vectors k0 and n, respectively. The angular parametrization of these products is done with polar coordinates in the coordinate frame defined by the right-handed triad ε0,1, ε0,2, and k0 of the incoming wave. Thus, nk0 = cos θ, nε0,1 = cos φsin θ, and nε0,2 = sin φsin θ, and dΩ = sin θdθdφ is the solid angle element. Accordingly, |n × k0| = sin θ, and
The e3 projection of the outgoing polarization triad is related to the e3 projection of the incoming triad as
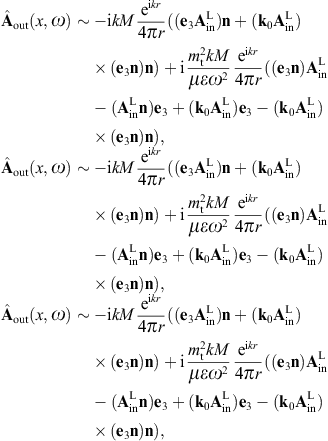
The angular parametrization of the polarized components of the diffracted wave (3.8) can readily be performed by substitution of these scalar products. The transversal εj projections of (3.8) read
The polarization vector of the incident wave,
We consider the special case where the incoming wave vector is normal to the plane of incidence. As k0 = e3, the angular parametrization of the cross sections greatly simplifies, but the above parametrization of the polarization triads can be used for any other incident wave vector as well. On performing the average over the initial transversal polarizations and a summation over the transversal outgoing polarizations, we obtain, cf. (3.14),
where we used
The angular parametrization of the longitudinal outgoing component (3.15) at normal incidence k0 = e3 reads
These averages suffice to calculate the intensity ratios determining the conversion efficiency, cf. (3.25).
In the far-field limit, the outgoing spherical waves are
structured as [28]
The transversal component
 ST,L
ST,L can be assembled with these asymptotic spherical waves as done in (3.4) for plane
waves. The transversal and longitudinal components of the diffracted
energy flux are
can be assembled with these asymptotic spherical waves as done in (3.4) for plane
waves. The transversal and longitudinal components of the diffracted
energy flux arewhere we substitute the amplitudes (3.14) and (3.15). The subscripts i and j refer to the respective incoming and outgoing transversal polarization states. These averages are obtained from the asymptotic time-averaged Poynting vectors, cf. after (3.3),
The diffracted flux components are to be compared to the flux carried by the incident transversal plane wave, cf. (3.4),
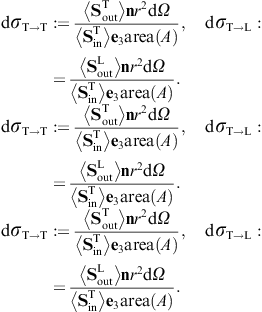
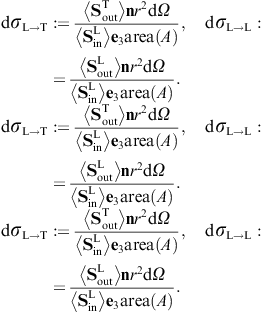
As for the outgoing flux vectors (3.21), we perform the same average/summation over the transversal polarizations as done in (3.16) and (3.18). The ratio of the outgoing flux transversally or longitudinally diffracted into the solid angle element dΩ and the transversal flux incident upon the aperture area is found as
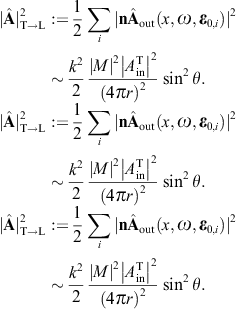
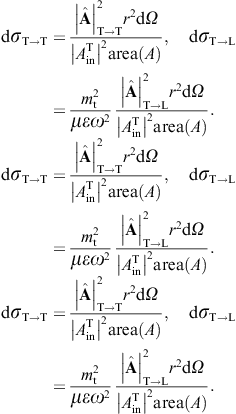
These are dimensionless intensity ratios, cross sections divided by the aperture area. On substituting the averages (3.16) and (3.18), we find the intensity ratios for the diffraction of transversal radiation,
Diffraction of transversal wave fields generates longitudinal modes, the conversion efficiency being determined by the ratio dσT→L/(dσT→T + dσT→L).
3.3. Intensity ratios for the conversion of longitudinal into transversal radiation
We consider an incident longitudinal plane wave, ![]() ,
cf. (3.3), and
proceed analogously to the transversal case in Section 3.2. Employing
the surface integrals (2.19), (2.20), (2.21) and (2.22), we find
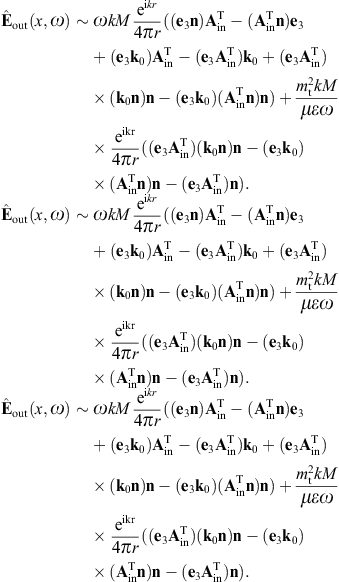
the diffracted electric field strength in the Fraunhofer regime,
,
cf. (3.3), and
proceed analogously to the transversal case in Section 3.2. Employing
the surface integrals (2.19), (2.20), (2.21) and (2.22), we find
the diffracted electric field strength in the Fraunhofer regime,
the vector potential,
and the magnetic field strength
The transversal polarization components of the diffracted vector potential
where we explicitly indicate the incoming longitudinal polarization k0 as argument. The outgoing longitudinal component is
The angular parametrization is explained in (3.11), (3.12) and (3.13). At normal incidence k0 = e3, we find
The transversally diffracted radiation is thus linearly polarized. The squared longitudinal component (3.31) is parametrized as, cf. (3.18),
Regarding the energy flux, we note the polarized outgoing Poynting vectors, cf. (3.21),
the incoming longitudinal flux vector, cf. (3.4),
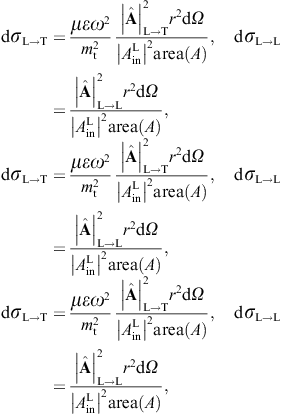
and the intensity ratios for the conversion of longitudinal radiation, cf. (3.24),
The conversion efficiency of longitudinal radiation into linearly polarized transversal tachyons is thus determined by the ratios, cf. (3.25),
with the squared amplitude projections (3.32) and (3.33) substituted.
4. Tachyonic Bragg scattering
4.1. Diffraction gratings: negative mass-square and Bragg condition
We start with a grating defined as an array of 2N + 1
slits parallel to the e2
axis (y coordinate). The slits are rectangles of
(large) height 2b and width 2a.
The x coordinate along e1
ranges in equidistantly spaced intervals [nd − a, nd + a],
where n = −N, …, 0, …, N,
and d > 2a.
The y coordinate of this grating aperture ranges in
[−b, b], and the
modulation function (3.6) factorizes
accordingly as
as well as two limit definitions of the delta function, δ(1),(2)(x, b → ∞) = δ(x), where
The modulation factor of the grating can thus be written as
where η := kq1d/2. In the squared modulation factor, we substitute
4.2. Tachyon diffraction in crystal lattices: transversal and longitudinal scattering cross sections
We consider a monochromatic superluminal radiation mode, ![]() ,
hitting a crystal lattice, and apply this field to the electron density
of the crystal. This generates a tachyonic current j(x, t) = qne(x)v(t),
where ne(x)
is the periodic electron density in the crystal lattice. The velocity
of the electrons carrying tachyonic charge q is
determined by
,
hitting a crystal lattice, and apply this field to the electron density
of the crystal. This generates a tachyonic current j(x, t) = qne(x)v(t),
where ne(x)
is the periodic electron density in the crystal lattice. The velocity
of the electrons carrying tachyonic charge q is
determined by ![]() .
(In the Heaviside–Lorentz system, q2/(4π
.
(In the Heaviside–Lorentz system, q2/(4π c)≈1.0×10⁻¹³,
estimated from Lamb shifts in hydrogenic ions [17].) In dipole
approximation, we may neglect the spatial dependence of the amplitude
 ![]() ,
so that
,
so that ![]() with
with ![]() .
We thus find the Fourier amplitude of the current
.
We thus find the Fourier amplitude of the current ![]() as [19]
as [19]
where we have put ε0 = ε = 1 and μ0 = μ = 1 (vacuum permeabilities in the Heaviside–Lorentz system). The charge density follows from current conservation,
where
Here, n = x/r is the coordinate unit vector used as longitudinal polarization vector, and εi = 1,2(x) are real transversal polarization vectors defining two degrees of linear polarization, so that εi and n constitute an orthonormal triad, which we choose as in (3.10). The outgoing transversal and longitudinal field components are stated in (3.19) and (3.20), where we put ε = μ = 1, replace the superscript T by T(i), and substitute
We further specify the wave field incident upon the crystal as
a plane wave ![]() ,
cf. before (3.2),
generating the current
,
cf. before (3.2),
generating the current ![]() in (4.5). The
polarized components
in (4.5). The
polarized components ![]() of the current transform (4.7) are thus
found as
of the current transform (4.7) are thus
found as
By making use of (3.19) and (3.20), we obtain the asymptotic outgoing field strengths,
As for the cross sections, we start with the transversal and longitudinal flux vectors
 ST(i),L
 in (3.22), and
substitute the scattered fields (3.19) and (3.20),
in (3.22), and
substitute the scattered fields (3.19) and (3.20),The squared current amplitudes (4.9) read
The total transversal flux
 ST
ST is obtained by adding the transversal polarization components
  ST(i)
ST(i) ,
which amounts to replacing the linearly polarized current transforms
 We also need the flux density of the incident plane wave, ![]() ,
decomposed into transversal and longitudinal components, cf. (3.2) and (3.3). The flux
carried by the transversal component,
,
decomposed into transversal and longitudinal components, cf. (3.2) and (3.3). The flux
carried by the transversal component, ![]() ,
reads, cf. (3.4),
,
reads, cf. (3.4),
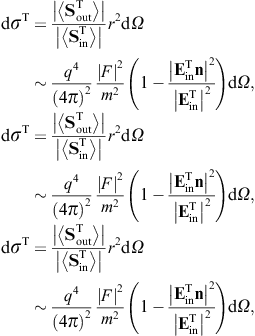
The transversal cross section for superluminal Bragg diffraction is thus found as
where the solid angle element dΩ is centered at the outgoing wave vector k′ = k(ω)n. We may replace the factor
 )/2,
where
  is the scattering angle between the in- and outgoing wave vectors k
and k′. In the
longitudinal cross section,
is the scattering angle between the in- and outgoing wave vectors k
and k′. In the
longitudinal cross section,we may replace the
 .
.
In the scattering amplitude F(k, n),
cf. (4.10), we write
k′ for k(ω)n,
and substitute the Fourier series ne(x)=∑nGeiGx
over the reciprocal lattice G,
 /2),
with scattering angle
  as above. The parallel lattice planes of the direct lattice orthogonal
to a fixed G are equidistantly spaced, at
distance d = 2π/|G0|,
where G0 is the
shortest reciprocal lattice vector parallel to G,
the latter being an integer multiple of G0,
|G| = n|G0|,
cf., e.g., Ref. [30]. Replacing
the wave number by frequency via the dispersion relation
 The angle
 /2
is the glancing angle between lattice plane and wave vector; incidence
and reflection angle coincide as in the electromagnetic case,
irrespectively of the polarization. Owing to the negative mass-square,
tachyonic Bragg diffraction can only occur at wavelengths λ = 2π/k < 2d,
where d is usually a few Å. This matches well with
the tachyonic Compton wavelength of 2π/mt ≈ 5.7Å
[17], which is
the maximal wavelength attainable by tachyonic vacuum modes.
5. Tachyonic flare spectra of TeV blazars
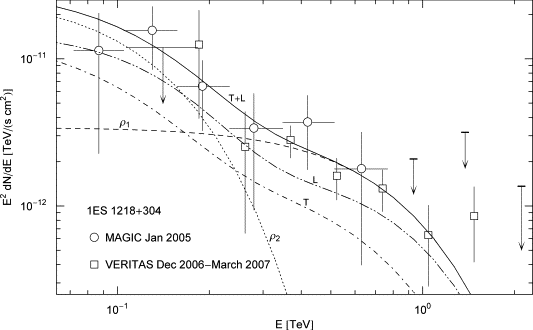
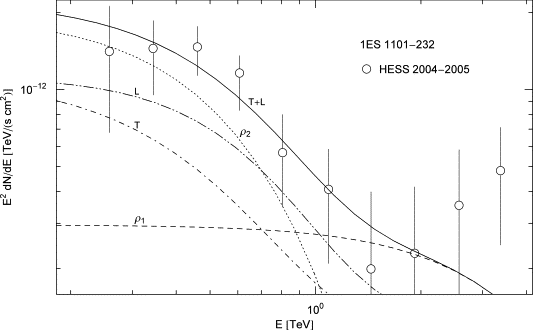
Fig. 1, Fig. 2 and Fig. 3 depict
tachyonic cascade fits to the TeV spectra of the γ-ray blazars
H2356 − 309, 1ES 1218 + 304, and
1ES 1101 − 232, obtained with imaging air Cherenkov
telescopes [31]. The
cascades are plots of the E2-rescaled
flux densities
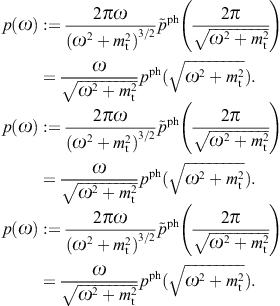
 pT,L(ω=E/
 )
) the tachyonic spectral density of a uniformly moving charge [8],
averaged over a thermal electron distribution. The superscripts T and L indicate the transversal and longitudinal polarization components defined by
 c)≈1.0×10⁻¹³
and mt ≈ 2.15 keV/c2,
as inferred from Lamb-shift estimates [17]. The
tachyon–electron mass ratio is mt/m ≈ 1/238,
and a spectral cutoff occurs at
c)≈1.0×10⁻¹³
and mt ≈ 2.15 keV/c2,
as inferred from Lamb-shift estimates [17]. The
tachyon–electron mass ratio is mt/m ≈ 1/238,
and a spectral cutoff occurs atOnly frequencies in the range 0
 ω
ω ωmax(γ)
can be radiated by a uniformly moving charge, the tachyonic spectral
densities pT,L(ω)
being cut off at the break frequency ωmax.
A positive ωmax(γ)
requires Lorentz factors exceeding the threshold μt.
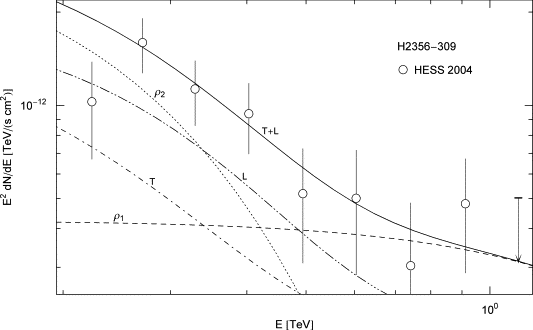
Fig. 1. Spectral map of the BL Lac object H2356 − 309. HESS data points from Ref. [31]. The solid line T + L depicts the E2-scaled differential tachyon flux dNT+L/dE, obtained by adding the flux densities ρ1,2 of two electron populations, cf. (5.1). The transversal (T) and longitudinal (L) flux densities dNT,L/dE add up to the total unpolarized flux T + L. The exponential decay of the cascades ρ1,2 sets in at about Ecut ≈ (mt/m)kT, cf. after (5.2), implying cutoffs at 0.84 TeV for the ρ1 cascade and 92 GeV for ρ2. The χ2 fit is done with the unpolarized tachyon flux T + L, and subsequently split into transversal and longitudinal components. Temperature and number count of the electron populations are recorded in Table 1.
Fig. 2. Spectral map of the blazar 1ES 1218 + 304. MAGIC data points from Ref. [35], VERITAS points from Ref. [36]. The upper flux limit in the 0.1–0.2 TeV interval is based on STACEE observations in 2006 and 2007 [37]. The spectral fit T + L = ρ1 + ρ2 is performed with the electron distributions quoted in Table 1; the polarized flux components are labeled T and L. The ρ1 cascade is cut at Ecut ≈ 0.28 TeV, and ρ2 at 46 GeV. Comparing to the BL Lac in Fig. 1, located at a lower redshift, there is no indication of absorption in the spectral slope. The electron densities generating the cascades ρ1,2 are thermal in either case. The spectral curvature is intrinsic, caused by the Boltzmann factor of the electron populations in the galactic nucleus.
Fig. 3. Spectral map of the BL Lac object 1ES 1101 − 232. HESS flux points from Ref. [38]. The plots are labeled as in Fig. 1 and Fig. 2. The ρ1 cascade is cut at 1.6 TeV and ρ2 at 0.21 TeV. The parameters of the electron populations are listed in Table 1. The spectral slope is steeper than that of 1ES 1218 + 304 in Fig. 2, even though these blazars have almost identical redshifts, which suggests that the shape of the plotted density E2dNT+L/dE is intrinsic rather than affected by intergalactic absorption; tachyonic γ-rays do not interact with background photons.
The average  pT,L(ω)
 defining the differential flux (5.1) is taken
over thermal ultra-relativistic electron distributions
 ![]() .
The least-squares fit is performed with the total unpolarized flux
density dNT+L = dNT + dNL.
The cascades are labeled ρ1,2
in the figures, and the parameters of the electron populations
generating them are listed in Table 1. The
details of the spectral fitting have been explained in Ref. [32]. The
electron count is calculated as
.
The least-squares fit is performed with the total unpolarized flux
density dNT+L = dNT + dNL.
The cascades are labeled ρ1,2
in the figures, and the parameters of the electron populations
generating them are listed in Table 1. The
details of the spectral fitting have been explained in Ref. [32]. The
electron count is calculated as ![]() ,
where
,
where ![]() defines the tachyonic flux amplitude extracted from the fit. The cutoff
parameter of the thermal cascades is related to the electron
temperature by kT[TeV] ≈ 5.11 × 10⁻⁷/β,
and the internal energy estimates of the source populations in Table 1 are
obtained from U[erg]
defines the tachyonic flux amplitude extracted from the fit. The cutoff
parameter of the thermal cascades is related to the electron
temperature by kT[TeV] ≈ 5.11 × 10⁻⁷/β,
and the internal energy estimates of the source populations in Table 1 are
obtained from U[erg]  2.46 × 10⁻⁶ne/β.
The distance estimates of the active galactic nuclei are based on d
  cz/H0,
with c/H0 ≈ 4.4 × 10³ Mpc.
Hence, d[Mpc] ≈ 4.4 × 10³z,
and
 ![]() ,
cf. Table 1.
,
cf. Table 1.
Electronic source distributions ρi
generating the tachyonic cascade spectra of the active galactic nuclei
in Fig. 1, Fig. 2 and Fig. 3. Each ρi
stands for a thermal ultra-relativistic Maxwell–Boltzmann density with
cutoff parameter β in the Boltzmann factor, cf.
after (5.3). ![]() determines the amplitude of the tachyon flux generated by the electron
density ρi, from which the
electron count ne∝d2
is inferred at the indicated distance. d is the
distance to the blazar, estimated from the redshift z.
kT is the temperature and U the
internal energy of the electron populations ρi,
cf. Ref. [42]. The
distance estimates do not affect the spectral maps in Fig. 1, Fig. 2 and Fig. 3, but the
electronic source count ne.
Each cascade depends on two fitting parameters β
and
determines the amplitude of the tachyon flux generated by the electron
density ρi, from which the
electron count ne∝d2
is inferred at the indicated distance. d is the
distance to the blazar, estimated from the redshift z.
kT is the temperature and U the
internal energy of the electron populations ρi,
cf. Ref. [42]. The
distance estimates do not affect the spectral maps in Fig. 1, Fig. 2 and Fig. 3, but the
electronic source count ne.
Each cascade depends on two fitting parameters β
and ![]() ,
extracted from the χ2 fit
T + L in the figures.
,
extracted from the χ2 fit
T + L in the figures.
Fig. 1 shows the
tachyonic spectral map of the blazar H2356 − 309 at
redshift z ≈ 0.165 [31]. TeV γ-ray
spectra of blazars are usually assumed to be generated by inverse
Compton scattering, which results in a flux of TeV photons thought to
be partially absorbed by interaction with infrared background photons,
so that the intrinsic spectrum has to be reconstructed on the basis of
intergalactic absorption models. By contrast, the extragalactic tachyon
flux is not attenuated by interaction with the background light, there
is no absorption of tachyonic γ-rays. Apparently, the curvature present
in the TeV spectra of blazars is not correlated with distance, at least
there is no evidence to that effect if we compare the spectral slopes
in Fig. 1, Fig. 2 and Fig. 3 to the
spectral maps of other flaring active galactic nuclei such as the BL
Lacertae objects (BL Lacs) H1426 + 428 (z ≈ 0.129,
570 Mpc) and 1ES 1959 + 650 (z ≈ 0.047,
210 Mpc) in Ref. [33], the
blazars 1ES 0229 + 200 (z ≈ 0.140,
620 Mpc) and ![]() (z ≈ 0.188, 830 Mpc) in
Ref. [32], and the
quasar 3C 279 (z ≈ 0.538,
2.4 Gpc) in Ref. [34]. Fig. 2 shows the
tachyonic spectral fit of the BL Lac 1ES 1218 + 304
at z ≈ 0.182 [35], [36] and [37], and Fig. 3 the
spectral map of the blazar 1ES 1101 − 232 at z ≈ 0.186
[38]. There is
no correlation between redshift and spectral curvature visible. The
curvature in the spectral maps of BL Lacs is intrinsic, generated by
the superluminal spectral densities of the thermal electron plasma in
the active galactic nuclei [39].
(z ≈ 0.188, 830 Mpc) in
Ref. [32], and the
quasar 3C 279 (z ≈ 0.538,
2.4 Gpc) in Ref. [34]. Fig. 2 shows the
tachyonic spectral fit of the BL Lac 1ES 1218 + 304
at z ≈ 0.182 [35], [36] and [37], and Fig. 3 the
spectral map of the blazar 1ES 1101 − 232 at z ≈ 0.186
[38]. There is
no correlation between redshift and spectral curvature visible. The
curvature in the spectral maps of BL Lacs is intrinsic, generated by
the superluminal spectral densities of the thermal electron plasma in
the active galactic nuclei [39].
6. Conclusion: tachyonic X-rays and Bragg spectrometers
We have outlined a diffraction theory of superluminal wave fields based on Kirchhoff identities, cf. Section 2, and discussed the specific case of tachyonic Bragg diffraction, first with regard to a grating aperture and then in crystal lattices, cf. Section 4. We analyzed the effect of diffraction on the polarization of tachyons, cf. Section 3, and separated the transversal and longitudinal flux components in the spectral maps of γ-ray blazars, cf. Section 5. A more detailed summary is given in the Introduction. Here, we briefly sketch how the negative mass-square shows in tachyonic X-ray spectra obtained with Bragg spectrometers.
Tachyonic spectral fits are based on the En-scaled
flux density, cf. (5.1),
 p(ω)
p(ω) is the unpolarized tachyonic spectral density pT + pL
in (5.2), averaged
over thermal [40] and [41] or
nonthermal [42] and [43] electronic
source populations. The exponent n is a
conveniently chosen real power: Observational spectra are usually
plotted as differential count rate dN/dE
(counts per unit time, unit area, and unit energy), or differential
energy flux EdN/dE
(which gives the power radiated if integrated over the respective
energy band), or as E2-rescaled
differential flux E2dN/dE
(energy per unit time and unit area, adopted in Section 5). If a Bragg
spectrometer is used, the primary quantity measured is the flux
depending on wavelength rather than energy [44]. The energy
parametrization in experimental plots is done with the assumed photonic
relation λ = 2π/ω,
which substantially differs from the tachyonic dispersion relation
 To this end, we start with an experimental plot of the
(assumed photonic) spectral density ![]() ,
parametrized by wavelength as inferred from the Bragg condition 2dsin(
,
parametrized by wavelength as inferred from the Bragg condition 2dsin( /2)=nλ.
The power radiated over a finite range of wavelengths is
 ![]() .
We reparametrize with energy via the photonic dispersion relation λ = 2π/ωph,
.
We reparametrize with energy via the photonic dispersion relation λ = 2π/ωph,
This observationally determined tachyonic spectral density p(ω) is to be fitted with the tachyonic spectral average
 p(ω)
p(ω) in (6.1). More
generally, if the photonic spectral density
 Tachyonic and photonic frequencies are related by
 mt,
which is not a severe restriction, as the condition λ < 2d
for Bragg scattering in a crystal amounts to roughly the same, cf. the
end of Section 4.2.
We consider a set of photonic data points ![]() labeled by index i. These flux points are inferred
from Bragg diffraction, that is, from the wavelength of the incident
quanta, and subsequently parametrized by frequency via the photonic
dispersion relation. If a tachyonic spectral fit based on density (6.1) is
performed, we have to use instead the tachyonic dispersion relation for
the energy parametrization. In effect, the photonic data points
labeled by index i. These flux points are inferred
from Bragg diffraction, that is, from the wavelength of the incident
quanta, and subsequently parametrized by frequency via the photonic
dispersion relation. If a tachyonic spectral fit based on density (6.1) is
performed, we have to use instead the tachyonic dispersion relation for
the energy parametrization. In effect, the photonic data points ![]() are mapped into tachyonic points (ωi, fn(ωi))
by
are mapped into tachyonic points (ωi, fn(ωi))
by
Acknowledgements
The author acknowledges the support of the Japan Society for the Promotion of Science. The hospitality and stimulating atmosphere of the Centre for Nonlinear Dynamics, Bharathidasan University, Trichy, and the Institute of Mathematical Sciences, Chennai, are likewise gratefully acknowledged.
References
 and V.L. Ginzburg, Sov. Phys. Usp. 15
(1972), p. 184.
  and V.P. Bykov, Sov. Phys. Usp. 33
(1990), p. 477.




 ∫Aexp(ik(k0-n)x′)dx′dy′,


