Abstract
The vapor–liquid phase equilibria, saturation curves and pressure isotherms of nitrogen, methane, methanol, carbon dioxide and helium are modeled with a closed-form non-cubic equation of state (EoS), developed to describe high-pressure and high-density properties of fluids. The EoS is analytic and applicable to pure compounds as well as mixtures in the full temperature range above the melting point (or lambda point in the case of normal fluid helium) and up to the limit density where the pressure singularity occurs. The temperature evolution of the EoS is determined by four temperature-dependent scale factors on which the EoS linearly depends. Above the critical temperature, these scale factors can be regressed from empirical supercritical isotherms. Based on the proposed EoS, the Helmholtz and Gibbs free energies of the mentioned fluids are calculated, also in closed form. In the subcritical regime, a convex Helmholtz free energy is obtained by way of the common tangent construction. The subcritical scale factors of the EoS are inferred from the empirical liquid and vapor saturation densities, so that the EoS is consistent with the common tangent construction and the measured coexistence curve.
Introduction
The purpose of this paper is to discuss phase equilibria, coexistence curves and high-pressure isotherms of nitrogen, methane, methanol, carbon dioxide and helium, based on a phenomenological fluid equation of state (EoS) that is analytic and of closed form. The proposed EoS is non-algebraic, its attractive potential containing a density-dependent exponential. Even though the EoS is non-cubic, it is designed in analogy to cubic equations [1,2,3,4,5,6,7,8]; its wide applicability from classical fluids to extreme quantum fluids like helium is due to the adaptability of the temperature-dependent scale factors of the EoS, which are broken power laws [9], and also because the EoS is detached from microscopic first principles, i.e. from the specific modeling of molecular interactions.
A detailed derivation of the EoS has been given in Ref. [9], centered at the critical point conditions, i.e. vanishing density derivatives of pressure at the critical point, which will not be repeated here. Otherwise, the paper is self-contained, the EoS is defined from scratch, and the main purpose is to demonstrate its applicability by discussing concrete examples of fluids for which accurate saturation data and high-pressure isothermal data are available. The emphasis is on high density and pressure, where cubic equations tend to be particularly inaccurate, as will be illustrated in the figures, and where virial expansions [10, 11] of molecular interaction models usually fail. The applicability of the EoS at high density is due to the fact that it is non-perturbative, avoiding the decomposition into a free exactly solvable model with additive interaction terms that are required to be small for perturbative expansion techniques.
In Sect. 2, we define the EoS, which is parametrized with five temperature-independent substance-specific constants to be regressed from the critical isotherm. These constants also determine the limit density of the EoS, where the pressure becomes singular. The regression of these constants from the empirical critical pressure isotherm is explained in Sect. 3.1.
The temperature evolution of the EoS is determined by four temperature-dependent scale factors. In the supercritical regime, these analytic scale factors are regressed from pressure isotherms, as done in Sects. 3.2 and 3.3. In the subcritical regime above the melting point (or lambda point in the case of normal fluid helium), the scale factors are calculated from the empirical saturation curve, by making use of the common tangent construction ensuring the convexity of the Helmholtz free energy (as a function of volume) in the subcritical temperature interval.
The pressure isotherms of the EoS will be tested with super- and subcritical isothermal data sets of nitrogen, methane, methanol, carbon dioxide and helium. The empirical saturation properties can be implemented in the temperature evolution of the EoS, as will be demonstrated here with these fluids. In the figures depicting selected isotherms and isothermal data sets, we also show the corresponding isotherms of the cubic Peng-Robinson EoS, which serves as a reference equation. We refrain from comparing with more general cubic equations, e.g. EoSs involving volume translations [1, 6] or non-cubic EoSs obtained from molecular interaction models such as SAFT or PC SAFT models [12,13,14], as these equations can be marred by intersecting isotherms and multiple Maxwell loops in the coexistence region [15], the latter also being encountered in multiparameter EoSs [16,17,18,19,20,21,22,23,24,25]. The data sets used for the regression are actually generated by multiparameter EoSs, see below.
In Sect. 4, we calculate the Helmholtz free energy of the mentioned fluids and perform the common tangent construction, which the EoS has to satisfy in order to be consistent with the empirical saturation properties. In Sect. 5, the equations of the common tangent construction are employed to calculate the subcritical scale factors of the EoS from the measured saturation curves. In this way, an analytic closed-form EoS is obtained, applicable above the melting point (or lambda point in the case of helium) and for densities up to the pressure singularity. In Sects. 3–5, we specifically derive the EoSs of nitrogen, methane, methanol, carbon dioxide and of normal fluid helium, using isothermal and saturation data sets from Ref. [26]; the latter are synthetic data based on a specific multiparameter reference EoS for the respective fluid inferred from a variety of experimental data sources. (These reference EoSs are quoted in Sect. 4.3 and also in the figures of the pressure isotherms where the data points are depicted.) The emphasis is on the mentioned fluids, but we keep the formalism sufficiently general for wider applicability to other compounds and multi-component mixtures. The conclusions are summarized in Sect. 6.
A Fluid Equation of State Applicable to Pure Compounds and Mixtures at High Pressure
The analytic closed-form EoS (pressure , molar density , temperature ) is defined as
with repulsive potential
A derivation thereof is given in Refs. [9, 27]. is the gas constant. The repulsive term is modeled in analogy to the Carnahan-Starling hard-sphere EoS [28, 29] and depends on five temperature-independent fitting parameters: the amplitude and exponent are positive, and the polynomial coefficients are real. The temperature-dependent scale factors in (2.2) and in (2.1) are normalized to zero at the critical temperature . The critical-point constants are denoted by and listed in Table 1 for the fluids studied here, that is nitrogen, methane, carbon dioxide, methanol and helium.
We will use the shortcuts , , for the constants and , ; a subscript comma followed by denotes a density derivative. Thus, and are the first- and second-order density derivatives of the repulsive potential (2.2), taken at the critical point. The EoS (2.1), (2.2) linearly depends on the rho and sigma functions , , which determine the temperature evolution of the EoS, apart from the term linear in temperature in (2.2).
The exponential of the second term (attractive potential of the EoS) in (2.1) is defined by the constants
derived from the critical-point conditions, , , which are exactly satisfied by the EoS, cf. Ref. [9]. The attractive term in (2.1) scales at low density and the repulsive term (2.2) is linear in the low-density regime. The positive real exponent in (2.2) is the pressure scaling exponent at the singularity (high-density limit). The analytic scale factors and in (2.1) and (2.2) will be specified in Sects. 3 and 5 for the super- and subcritical temperature ranges.
Parameters and Supercritical Scale Factors of the EoS
Density Dependence of Pressure at the Critical Temperature
The temperature-dependent and scale factors of the EoS (2.1), (2.2) vanish at the critical temperature, . The critical isotherms of nitrogen, methane, carbon dioxide, methanol and helium are obtained by four-parameter regression, since we put in (2.2) from the outset because of lack of high-pressure data points. The temperature-independent fitting parameters are recorded in Table 2. The least-squares functional to be minimized reads
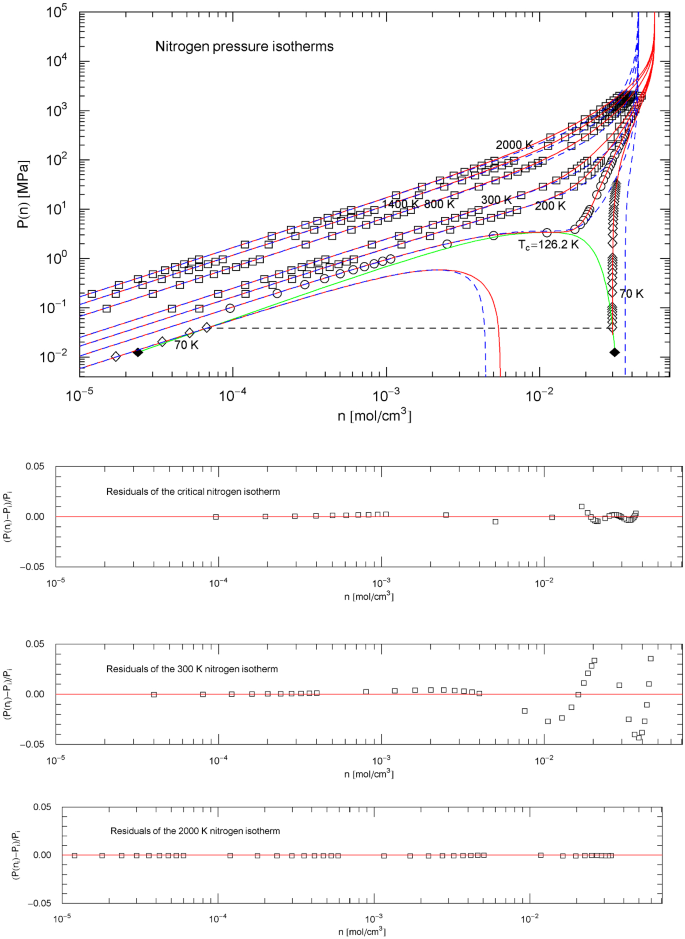
where are data points for the critical isotherm, and is the EoS (2.1), (2.2) with and the and scale factors put to zero. The regressed isotherms, temperature-dependent scale factors and saturation curves of nitrogen are depicted in Figs. 1, 2, 3, 4, and 5, of methane in Figs. 6, 7, 8, 9, and 10, carbon dioxide in Figs. 11, 12, 13, 14, and 15, methanol in Figs. 16, 17, 18, 19, and 20 and helium in Figs. 21, 22, 23, 24 and 25. The functionals used for the regression of supercritical isotherms in Sects. 3.2 and for the saturation densities and pressure in Sect. 4.3 are structured analogously to (3.1). The data points depicted in the figures are taken from Ref. [26], see the captions of Figs. 1, 6, 11, 16 and 21 and also Sect. 4.3 where the multiparameter EoSs generating these data are referenced; residual plots of the isotherms are also included in these figures.
Nitrogen pressure isotherms. Data points from Ref. [26]; the multiparameter reference EoS used to generate the data points of the nitrogen isotherms in Ref. [26] is stated in Refs. [16, 17]. Squares/circles/diamonds indicate supercritical/critical/subcritical isothermal data points, respectively. The red solid curves show isotherms of EoS (2.1), (2.2) (with parameters in Table 2). The scale factors , of the EoS of nitrogen in the supercritical regime are defined in (3.3) and Table 4. In the subcritical interval above the melting temperature, the scale factors , are calculated from the empirical saturation curve (green solid curve), cf. Sect. 5. Depicted are the supercritical isotherms at 2000, 1400, 800, 300 and 200 K, as well as the critical isotherm passing through the critical point at 126.19 K, and also the subcritical 70 K isotherm (red solid curves). The horizontal dashed line crossing the coexistence region connects the vapor and liquid saturation points on the 70 K isotherm, cf. Sect. 4.2. The black diamonds indicate the end points of the liquid–vapor saturation curve at the melting temperature of 63.15 K. Also depicted for comparison are the isotherms of the cubic Peng–Robinson (PR) EoS (blue dashed curves), cf. (3.2). Residuals of selected isotherms are shown in the lower panels, the labeling data points
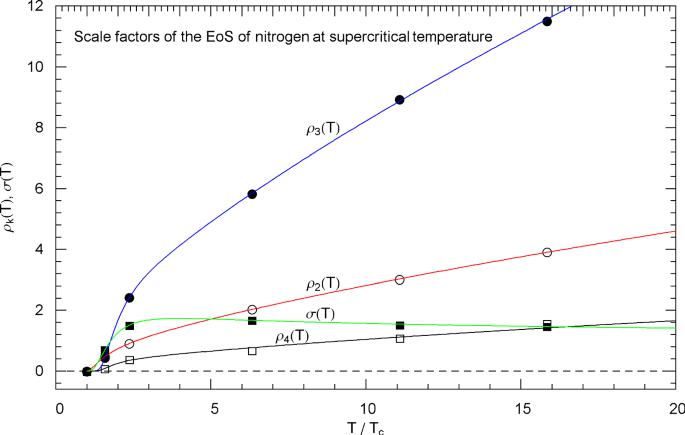
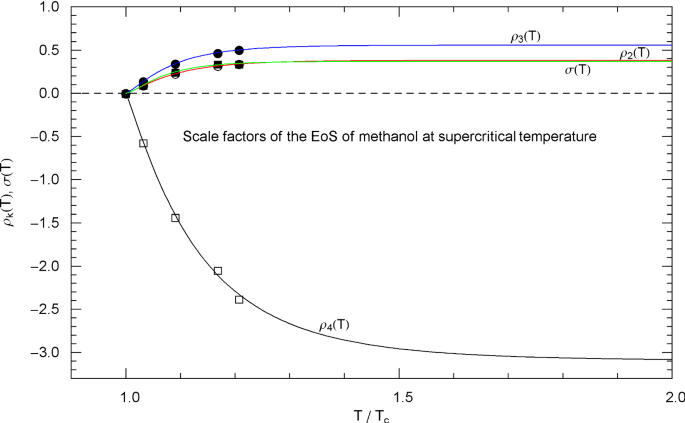
Supercritical scale factors , of the EoS of nitrogen, cf. Section 3.3. The circles/squares show data points , from Table 3, at , 200, 300, 800, 1400 and 2000 K, cf. Section 3.2. The solid curves depict the regressed supercritical and scale factors (3.3) of the EoS (2.1), (2.2), with fitting parameters in Table 4
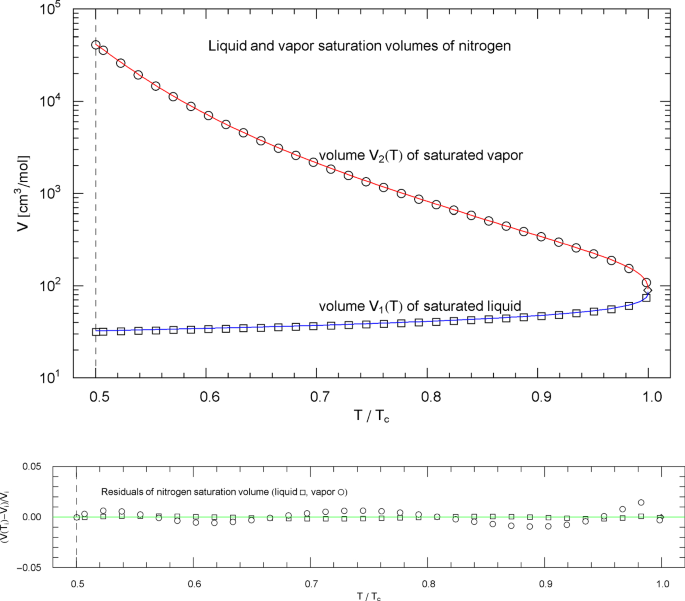
Liquid and vapor saturation volumes of nitrogen, cf. Section 4.3. Data points from Ref. [26]. Depicted are the liquid saturation volume in (4.6) with regressed parameters in Table 9 (blue curve) and the vapor saturation volume in (4.7) with parameters in Table 10 (red curve). The temperature range covers the subcritical interval, , cf. Table 1. The vertical dashed line indicates the reduced melting temperature, and the diamond depicts the critical point . Residuals of the liquid and vapor branches of the regressed saturation volume are shown in the lower panel, the labeling data points
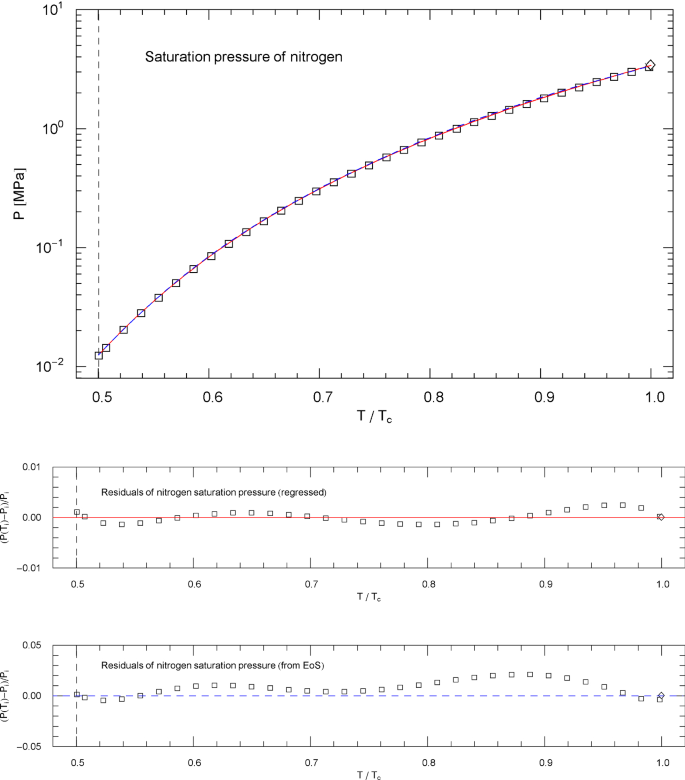
Saturation pressure of nitrogen. Data points from Ref. [26]. Depicted is the regressed saturation pressure in (4.8), with parameters in Table 11 (solid red curve). The vertical dashed line indicates the reduced melting temperature, and the diamond depicts the critical point . The blue dashed curve shows the saturation pressure calculated via EoS (2.1), (2.2) (with subcritical scale factors , in (5.7)), where is the liquid saturation density, cf. Sects. 4.2, 4.3 and Fig. 3. and very nearly coincide, which is a consistency check of the subcritical EoS, cf. Section 5. Residuals of the regressed and calculated (from EoS) saturation pressure are depicted in the lower panels, the labeling data points
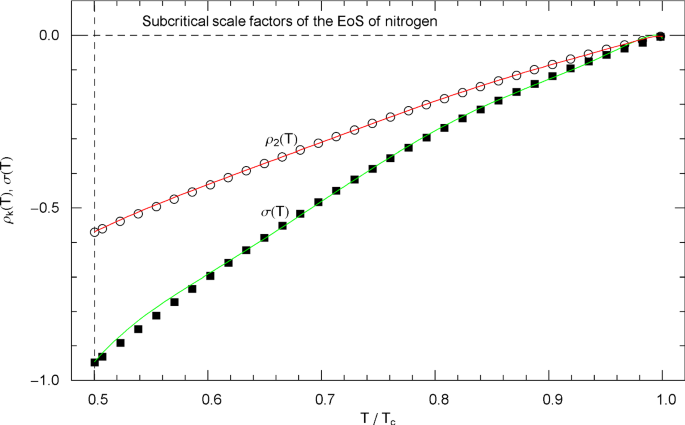
Subcritical scale factors of the EoS of nitrogen. The red and green curves show the scale factors and of EoS (2.1), (2.2) in the subcritical interval , cf. (5.7). (The scale factors and of the EoS have been put to zero in this interval.) The vertical dashed line indicates the reduced melting temperature. The depicted data points were calculated from empirical saturation data in Fig. 3 by making use of the common tangent construction to the free energy, cf. Sects. 4.2 and 5
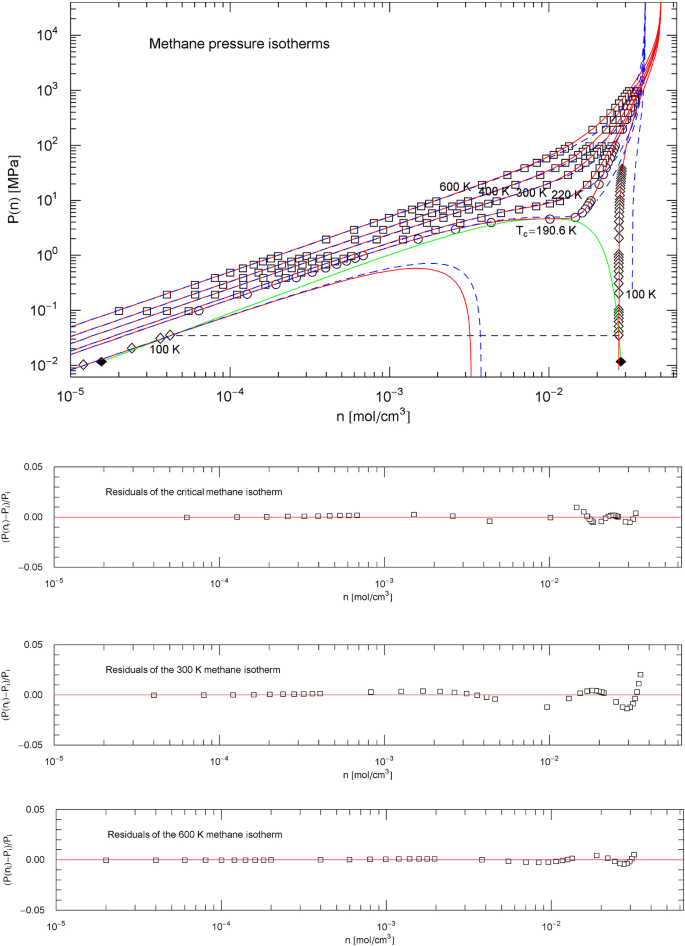
Methane pressure isotherms. Data points from Ref. [26]; see also Ref. [19] for the multiparameter reference EoS used to generate the data. The red solid curves show isotherms of EoS (2.1), (2.2) (with parameters in Table 2). The scale factors , of the EoS of methane in the supercritical regime are defined in (3.3), (3.4) and Table 5. In the subcritical temperature interval , the scale factors are calculated from the empirical saturation curve (green solid curve), cf. Sects. 4.2, 4.3 and 5. Depicted are the supercritical isotherms at 600, 400, 300 and 220 K as well as the critical isotherm at 190.56 K and also the subcritical 100 K isotherm (red solid curves). The horizontal dashed line connects the vapor and liquid saturation points on the 100 K isotherm, cf. Section 4.2. The black diamonds indicate the end points of the liquid–vapor saturation curve at the melting temperature of 90.69 K. Also depicted for comparison are the isotherms of the cubic PR EoS (blue dashed curves), cf. (3.2) and Table 1. Residuals of selected isotherms are shown in the lower panels
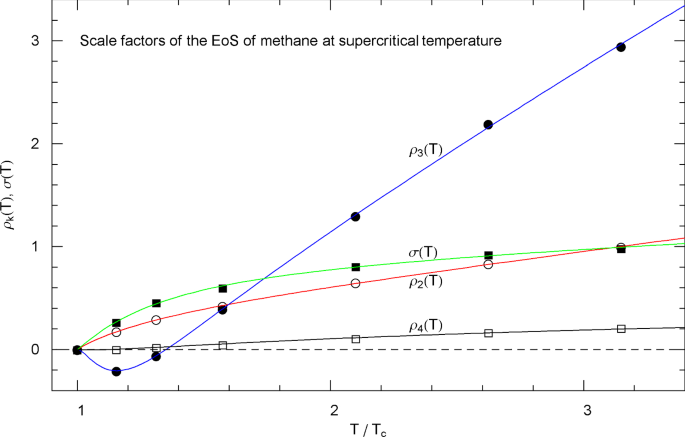
Supercritical scale factors , of the EoS of methane, cf. Section 3.3. The circles/squares show data points , from Table 3, at , 220, 250, 300, 400, 500 and 600 K, cf. Section 3.2. The solid curves depict the regressed supercritical rho and sigma functions , in (3.3) and in (3.4), with fitting parameters in Table 5
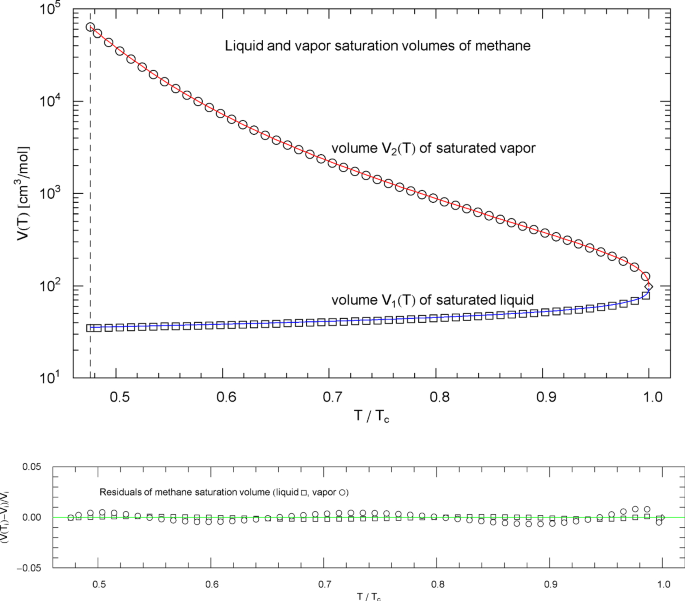
Liquid and vapor saturation volumes of methane, cf. Section 4.3. Data points from Ref. [26]. Depicted are the liquid saturation volume in (4.6) with parameters in Table 9 (blue curve) and the vapor saturation volume in (4.7) with parameters in Table 10 (red curve). The temperature range covers the subcritical interval, from the melting point at 90.69 K to the critical temperature at 190.56 K, cf. Table 1. The diamond indicates the critical point . Residuals of the regressed liquid and vapor saturation volumes are shown in the lower panel
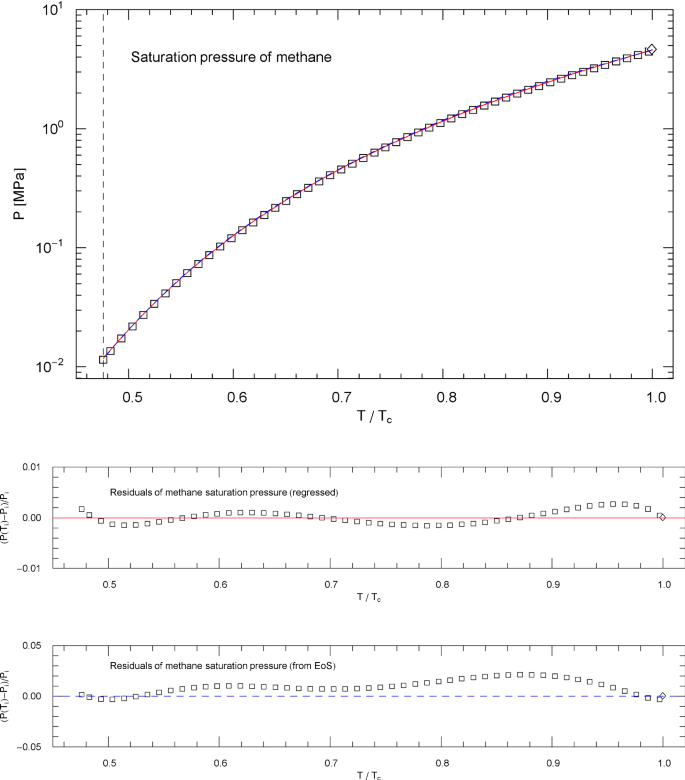
Saturation pressure of methane. Data points from Ref. [26]. Depicted is the regressed saturation pressure in (4.8) with parameters in Table 11 (solid red curve). The vertical dashed line indicates the reduced temperature of the melting point, and the diamond depicts the critical point , cf. Table 1. The blue dashed curve shows the saturation pressure calculated via EoS (2.1), (2.2) (with subcritical scale factors , in (5.7)), where is the liquid saturation density, cf. Sects. 4.2, 4.3 and Fig. 8. and very nearly coincide, which is a consistency check of the subcritical EoS, cf. Sect. 5. Residuals of the regressed and calculated (from EoS) saturation pressure are shown in the lower panels
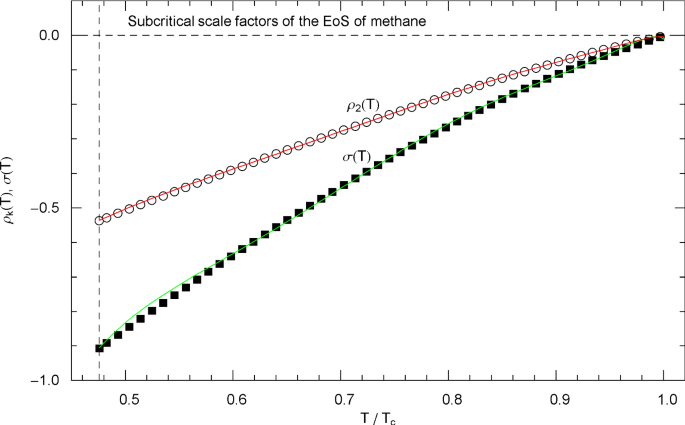
Subcritical scale factors of the EoS of methane. The red and green curves show the scale factors and of EoS (2.1), (2.2) in the subcritical interval , calculated in (5.7). (The scale factors and of the EoS have been put to zero in this interval.) The vertical dashed line indicates the melting temperature, cf. Table 1. The depicted data points were obtained from empirical saturation data in Fig. 8 by making use of the double-tangent construction to the free energy, cf. Sects. 4.2 and 5
In Figs. 1, 6, 11, 16 and 21, the critical pressure isotherm of EoS (2.1), (2.2) and selected super- and subcritical isotherms discussed in the subsequent sections are compared with the universal cubic Peng- Robinson (PR) EoS, cf. e.g. Refs. [1,2,3,4,5,6,7,8]
where , , , , and , , , are universal constants. The scale factor (alpha function [30,31,32,33]) of the PR EoS (3.2) reads , with , cf. Ref. [34], where denotes the acentric factor of the fluid. The critical point parameters (,,) and are recorded in Table 1 for nitrogen, methane, carbon dioxide, methanol and helium.
Pressure Isotherms of the EoS Above the Critical Temperature
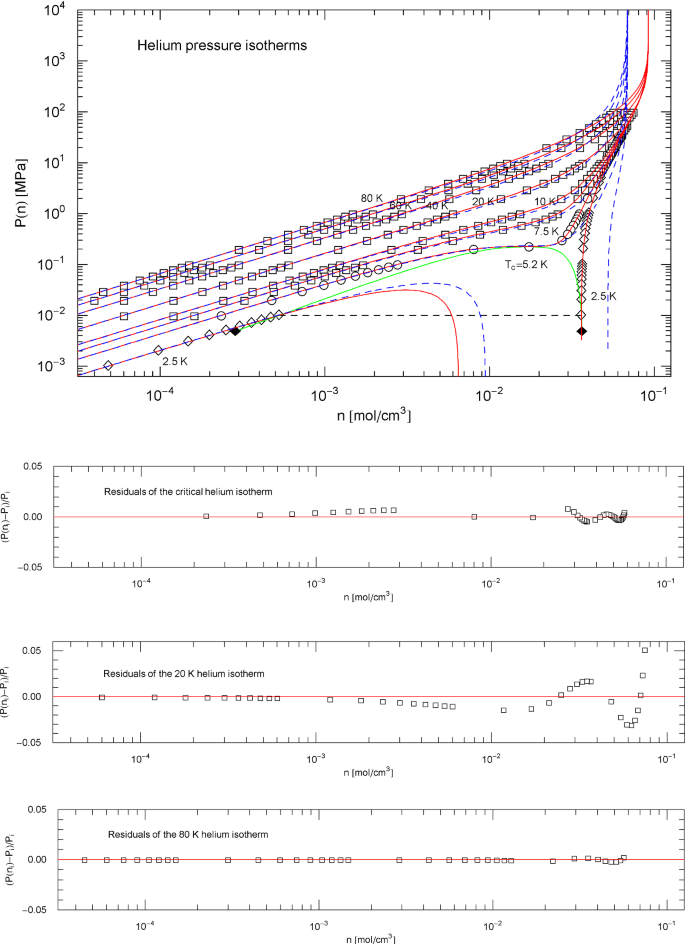
The rho and sigma functions and of the EoS (2.1), (2.2) can be treated as four independent fitting parameters at a fixed supercritical temperature . The temperature-independent parameters of the EoS have already been determined from the critical isotherm, cf. Section 3.1, so that and remain the only fitting parameters. In Table 3, we list and at selected supercritical temperatures , for nitrogen, methane, carbon dioxide, methanol and helium. The regressed supercritical isotherms of these fluids are depicted in Figs. 1, 6, 11, 16 and 21, together with their residual plots. The blue dashed curves in these figures show the corresponding isotherms (at the same supercritical temperatures ) of the cubic PR EoS.
Analytic Temperature Evolution of the Supercritical EoS
Above the critical temperature, , the and scale factors of the EoS (2.1), (2.2) can be specified as broken power-law density [35,36,37],
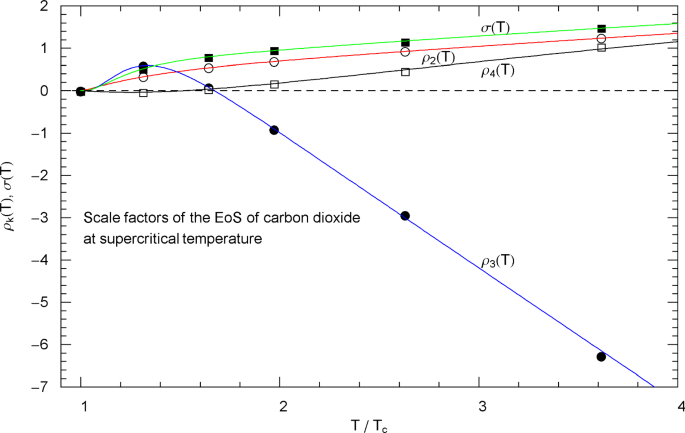
and the same power law is used for the rho functions (with different fitting parameters , , , , of course). If there is a sign change of or , as it happens in the case of methane and carbon dioxide, cf. Table 3, we use a slightly more general broken power law by adding a third factor,
The fitting parameters are the real amplitude , the positive exponents , and the real exponent . In (3.4), the positive amplitude in the third factor is an additional fitting parameter determining the temperature at the sign change of .
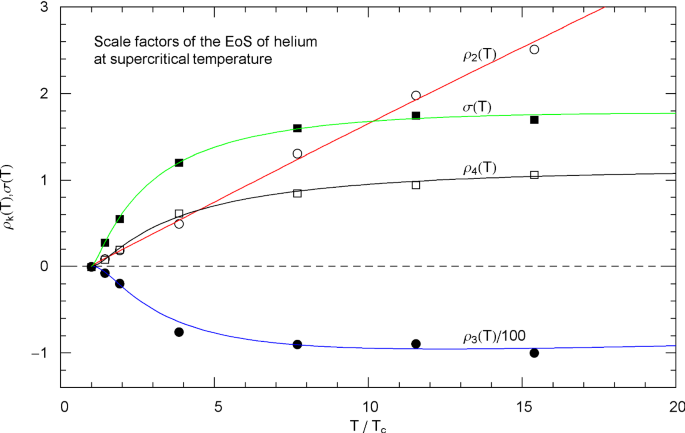
The regression is based on data sets , , , recorded in Table 3. The regressed parameters defining the supercritical scale factors of nitrogen, methanol and helium and the parameters of methane and carbon dioxide are listed in Tables 4, 5, 6, 7 and 8, and the least-squares fits of the broken power laws (3.3) and (3.4) are depicted in Figs. 2, 7, 12, 17 and 22 for these fluids.
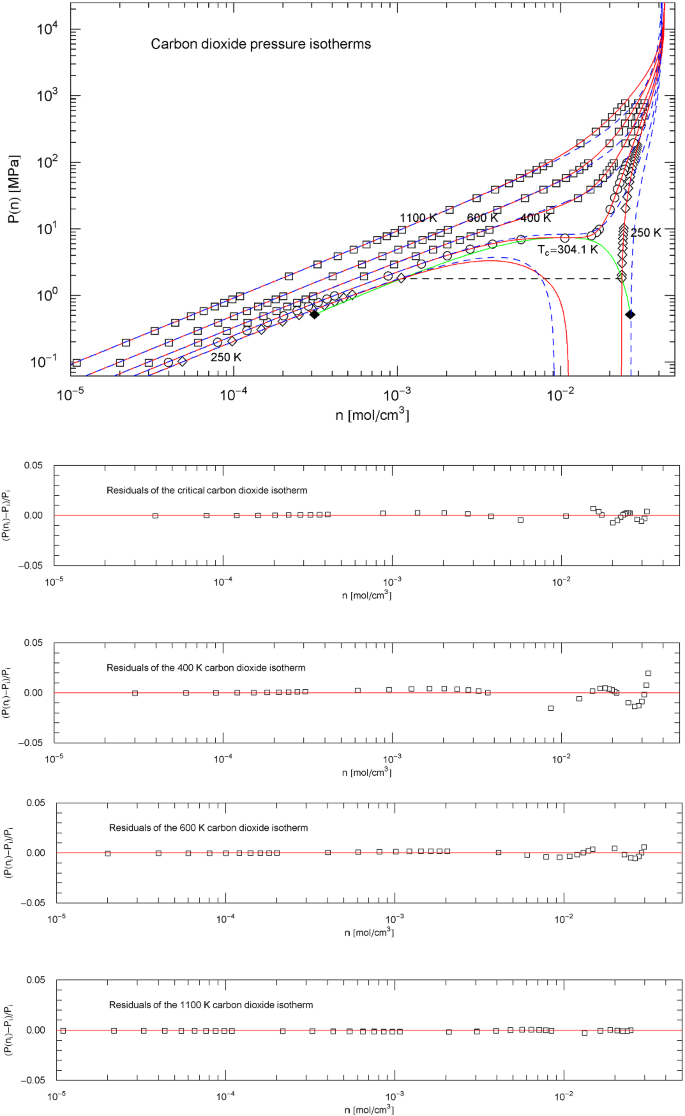
Carbon dioxide pressure isotherms. Data points from Ref. [26]; see also Ref. [20] for the multiparameter reference EoS used to generate the data. The red solid curves show isotherms of EoS (2.1), (2.2) (with parameters for carbon dioxide in Table 2). The scale factors , of the EoS of carbon dioxide in the supercritical regime are defined in (3.3), (3.4) and Table 6. In the subcritical temperature interval , the scale factors , are calculated from the empirical saturation curve (green solid curve), cf. Sects. 4.2, 4.3 and 5. The red solid curves show the supercritical isotherms at 1100, 600 and 400 K, as well as the critical isotherm passing through the critical point at 304.13 K and also the subcritical 250 K isotherm. The horizontal dashed line connects the vapor and liquid saturation points on the 250 K isotherm, cf. Section 4.2. The endpoints of the liquid–vapor saturation curve at the melting temperature of 216.6 K are depicted as black diamonds. Also shown for comparison are the isotherms of the cubic Peng–Robinson EoS (blue dashed curves), cf. (3.2) and Table 1. Residuals of selected isotherms are shown in the lower panels
Supercritical scale factors , of the EoS of carbon dioxide, cf. Section 3.3. The circles/squares show data points , from Table 3, at , 400, 500, 600, 800 and 1100 K, cf. Section 3.2. The solid curves depict the regressed supercritical rho and sigma functions , in (3.3) and in (3.4), with fitting parameters in Table 6
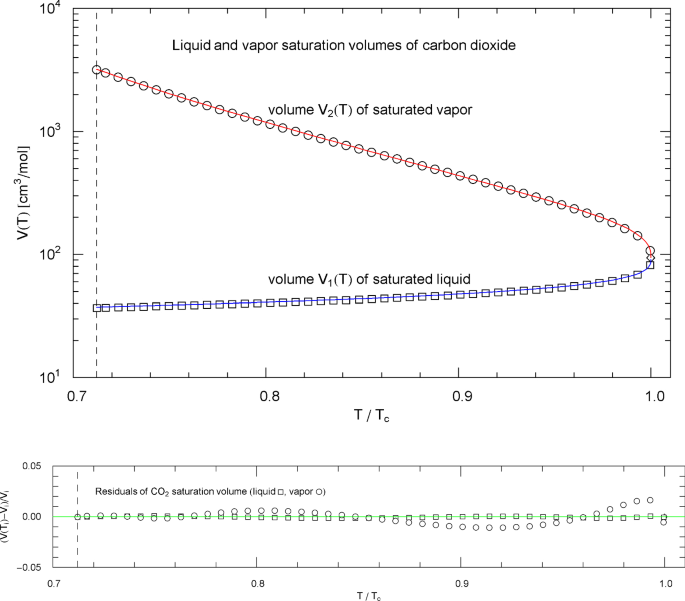
Liquid and vapor saturation volumes of carbon dioxide (CO2). Data points (squares, circles) from Ref. [26]. Depicted are the liquid saturation volume in (4.6) with parameters in Table 9 (blue curve), and the vapor saturation volume in (4.7) with parameters in Table 10 (red curve). The temperature range covers the subcritical interval, from the melting temperature of 216.6 K to the critical temperature of 304.13 K, cf. Table 1. The vertical dashed line indicates the reduced melting temperature, and the diamond depicts the critical point . Residuals of the regressed liquid and vapor saturation volumes are shown in the lower panel
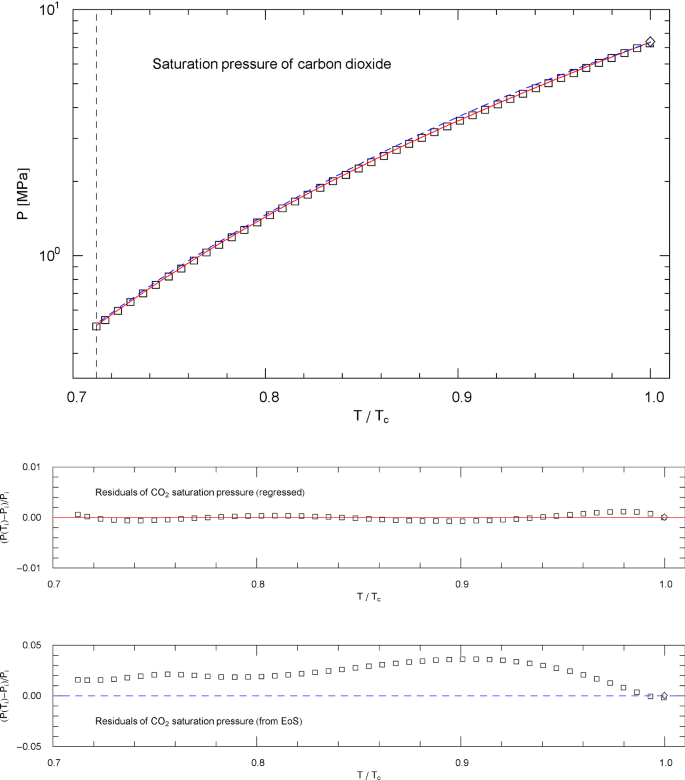
Saturation pressure of carbon dioxide, cf. Section 4.3. Data points from Ref. [26]. Depicted is the regressed saturation pressure in (4.8), with parameters in Table 11 (solid red curve). The vertical dashed line indicates the reduced melting temperature, and the diamond depicts the critical point , cf. Table 1. The blue dashed curve shows the saturation pressure calculated via EoS (2.1), (2.2) (with subcritical scale factors , in (5.7)), where is the liquid saturation density, cf. Sects. 4.2, 4.3 and Fig. 13. and very nearly coincide, which is a consistency check of the subcritical EoS, cf. Sect. 5. Residuals of the regressed and calculated (from EoS) saturation pressure are shown in the lower panels
Subcritical Equation of State
Density Integration of the EoS: Free Energy
The Helmholtz free energy is related to pressure by , where denotes volume and subscript commas indicate derivatives. In EoS (2.1), (2.2), molar density is used as parameter instead of volume, so that pressure is related to the free energy by . Thus the molar free energy is obtained from EoS (2.1), (2.2) as , up to an integration constant.
We split the free energy into additive components, using term-by-term integration of EoS (2.1), (2.2),
where
and . The constants are defined in (2.3).
The integrand of in (4.2) has the hypergeometric antiderivative in the relevant density range . (Here, denotes a hypergeometric function not to be confused with the integrals in (4.2).) More conveniently, , where is the generalized incomplete beta function, which is a built-in function in Mathematica® [38].
The integrals are elementary,
A non-integer pressure scaling exponent is assumed here, cf. Section 2, since this exponent is a fitting parameter. (At integer , the integrals are elementary as well, but we will not need these limit cases here.)
The integral in (4.2) can also be expressed in closed form,
where is the imaginary error function [39], which is also a built-in function in Mathematica®. The real coefficients , are defined in (2.3), and Eq. (4.4) remains valid for negative by way of analytic continuation.
Convexity of the Helmholtz Free Energy: Subcritical Common Tangent Construction
We reparametrize the EoS (cf. (2.1), (2.2)) and free energy (cf. (4.1)) with molar volume, replacing the density by (and by ) and writing and in this section, occasionally suppressing the temperature variable , which is kept fixed. The free energy in (4.1) is a convex function (in linear coordinates) in the supercritical temperature range . To make the free energy also convex in the subcritical interval above the melting temperature , we employ the double-tangent construction. (In the case of helium, is to be replaced by the lambda point of 2.17 K throughout Sects. 4 and 5.) That is, we will find a straight line that is tangent to the free energy at two volumes and , , so that the free energy becomes a convex function if is replaced, in the interval , by this tangent line.
The equation of the double tangent in linear coordinates (where convexity properties are apparent) reads , where is the tangent slope and the vertical intercept. Primes denote derivatives. Since , we find and analogously for . As , the stated equations for are equivalent to , , where is the Gibbs potential in volume parametrization.
The saturation curve (depicted as green solid curve in Figs. 1, 6, 11, 16 and 21) intersects a subcritical pressure isotherm (fixed , ) at the points and . Also, and , since the saturation curve passes through the critical point . We will refer to and as liquid and vapor saturation volumes, respectively. The corresponding molar liquid and vapor saturation densities are and , respectively, and .
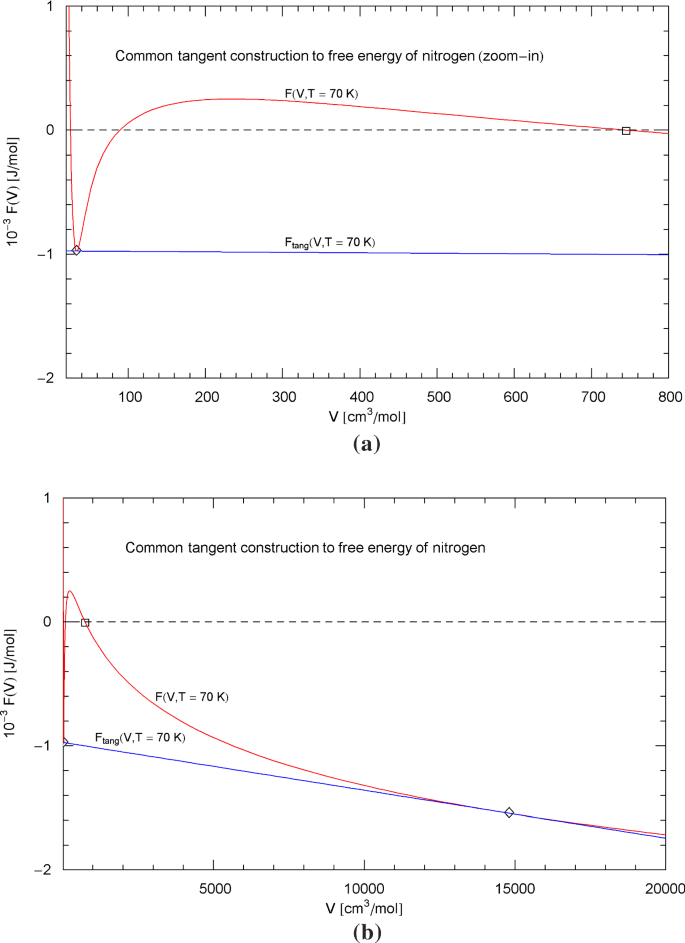
The common tangent construction to the free energy of nitrogen at 70 K is depicted in Fig. 26 as a quantitative example. The tangent points (diamonds) to the free energy in (4.1), (4.2) are located at the liquid and vapor saturation volumes and , which differ by three orders of magnitude, cf. the caption of Fig. 26. Linear coordinates are used in Fig. 26 to visualize the convexity of when modified by the tangent section between the saturation volumes.
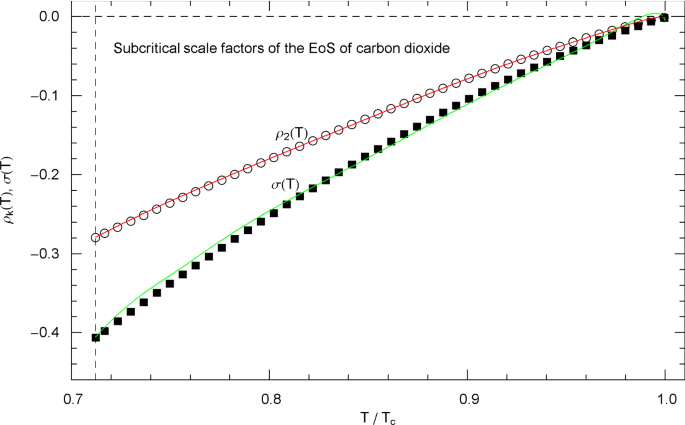
Subcritical scale factors of the EoS of carbon dioxide. The red and green curves show the scale factors and of EoS (2.1), (2.2) in the subcritical interval , cf. (5.7). The scale factors and of the EoS have been put to zero in this interval. The vertical dashed line indicates the reduced melting temperature, cf. Table 1. The depicted data points were obtained from empirical saturation data in Fig. 13, by solving Eqs. (4.5) of the double-tangent construction to the free energy, cf. Sects. 4.2 and 5
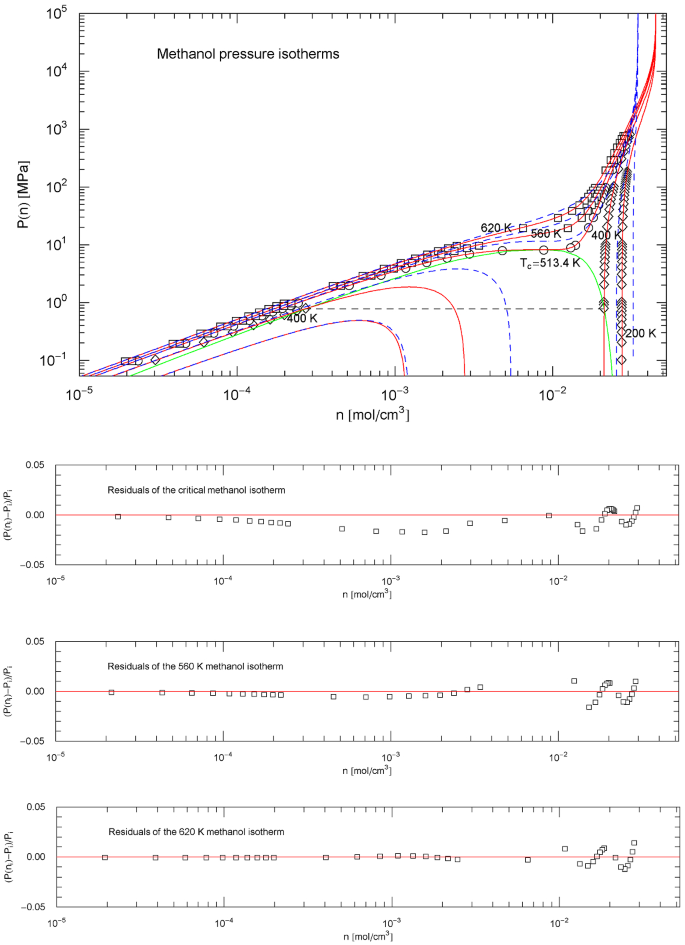
The saturation curves of nitrogen, methane, carbon dioxide, methanol and helium are shown as green solid curves in Figs. 1, 6, 11, 16 and 21, respectively. In the pressure– density plots of these figures, the saturation curve parametrized by temperature consists of two branches, (saturated liquid) and (saturated vapor), which are smoothly joint at the critical point , see also Figs. 3, 8, 13, 18 and 23 depicting the reciprocal saturation densities. The endpoints of the liquid and vapor branches of the saturation curve, that is and , are indicated as black diamonds in Figs. 1, 6, 11 and 21. In the case of methanol, the saturation curve extends to very low pressure far outside the pressure range shown in Fig. 16, as is evident from the saturation pressure curve in Fig. 19. In the case of (normal fluid) helium, is replaced by the lambda point.
Methanol pressure isotherms. Data points from Ref. [26], based on data tables in Ref. [43]. Red solid curves depict isotherms of EoS (2.1), (2.2) (with parameters in Table 2). The scale factors , of the EoS of methanol in the supercritical regime are defined in (3.3) and Table 7. In the subcritical interval , the scale factors , are calculated from the empirical saturation curve (green solid curve), cf. Sects. 4.2, 4.3 and 5. The red solid curves show the supercritical isotherms at 620 and 560 K, the critical isotherm at 513.38 K and the subcritical 400 and 200 K isotherms. The horizontal dashed line connects the vapor and liquid saturation points on the 400 K isotherm, cf. Section 4.2. The endpoints of the liquid − vapor saturation curve at the melting temperature of 175.61 K are not shown, as they are located far outside the depicted pressure range, cf. Fig. 19. The saturation points on the 200 K isotherm are not visible in this figure for the same reason. Also shown are the isotherms of the cubic PR EoS (blue dashed curves), cf. (3.2) and Table 1. Residuals of selected isotherms are depicted in the lower panels
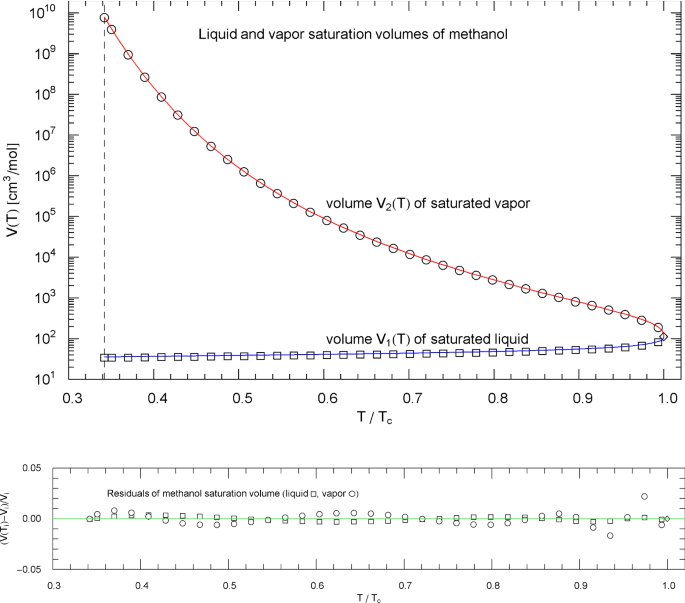
Liquid and vapor saturation volumes of methanol, cf. Section 4.3. Data points (squares, circles) from Ref. [26]. Depicted are the liquid saturation volume in (4.6) with parameters in Table 9 (blue curve) and the vapor saturation volume in (4.7) with parameters in Table 10 (red curve). The temperature range covers the subcritical interval, from the melting temperature of 175.61 K to the critical temperature of 513.38 K. The vertical dashed line indicates the reduced melting temperature, and the diamond depicts the critical point . Residuals of the liquid and vapor branches of the regressed saturation volume are shown in the lower panel
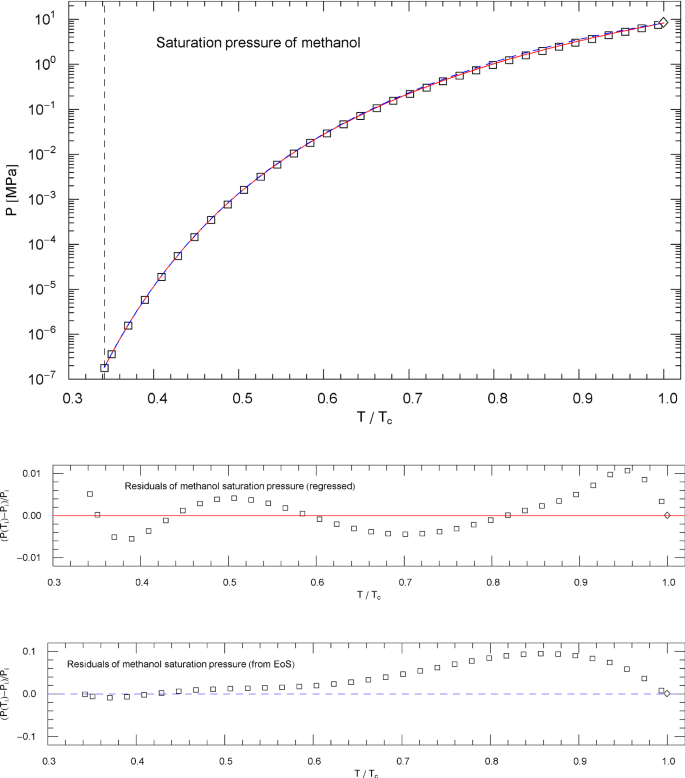
Saturation pressure of methanol. Data points from Ref. [26]. Depicted is the regressed saturation pressure in (4.8), with parameters in Table 11 (solid red curve). The vertical dashed line indicates the reduced melting temperature, and the diamond depicts the critical point . The blue dashed curve shows the saturation pressure calculated via EoS (2.1), (2.2) (with subcritical scale factors , in (5.7)), where is the liquid saturation density of methanol, cf. Sects. 4.2, 4.3 and Fig. 18. and very nearly coincide, which is a consistency check of the subcritical EoS, cf. Sect. 5. Residuals of the regressed and calculated (from EoS) saturation pressure are depicted in the lower panels
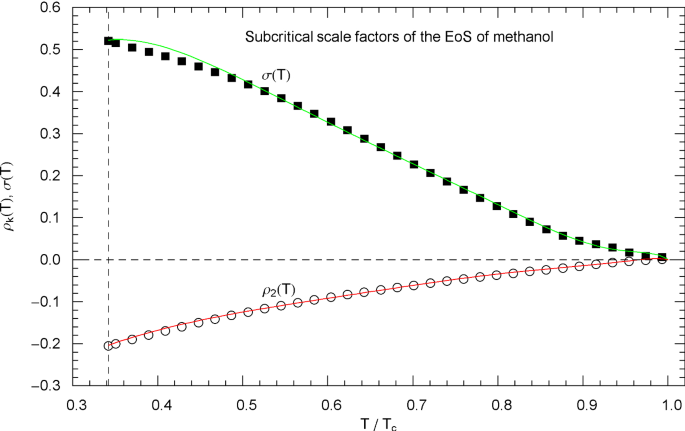
Subcritical scale factors of the EoS of methanol. The red and green curves show the scale factors and of EoS (2.1), (2.2) in the subcritical interval calculated in (5.7). The scale factors and of the EoS have been put to zero in this interval. The vertical dashed line indicates the reduced melting temperature of methanol, cf. Table 1. The depicted data points were obtained from empirical saturation data, cf. Fig. 18, by solving Eqs. (4.5) of the common tangent construction to the free energy, cf. Sects. 4.2 and 5
Pressure isotherms of normal fluid helium. Data points from Ref. [26]; see also Ref. [44] for the multiparameter reference EoS used to generate the data. The red solid curves show isotherms of the EoS (2.1), (2.2) (with parameters in Table 2). The scale factors , of the EoS of helium in the supercritical regime are defined in (3.3) and Table 8. In the subcritical temperature interval above the lambda point, and are calculated from the empirical saturation curve (green solid curve), cf. Section 5. Depicted are the supercritical isotherms at 80, 60, 40, 20, 10 and 7.5 K as well as the critical isotherm at 5.195 K and the subcritical 2.5 K isotherm (red solid curves). The horizontal dashed line crossing the coexistence region connects the vapor and liquid saturation points on the 2.5 K isotherm, cf. Section 4.2. The black diamonds indicate the end points of the liquid − vapor saturation curve of normal fluid helium at the lambda point of 2.17 K. Also depicted are the isotherms of the cubic PR EoS (blue dashed curves), cf. (3.2) and Table 1. Residuals of selected isotherms are shown in the lower panels
According to the above double-tangent construction, and coincide on the liquid and vapor branches of the saturation curve, determining the saturation pressure depicted in Figs. 4, 9, 14, 19 and 24. The liquid and vapor saturation densities , at the melting temperature (or lambda point) differ by several orders of magnitude, as illustrated by Figs. 3, 8, 13, 18 and 23 showing the saturation volumes (i.e. inverse saturation densities).
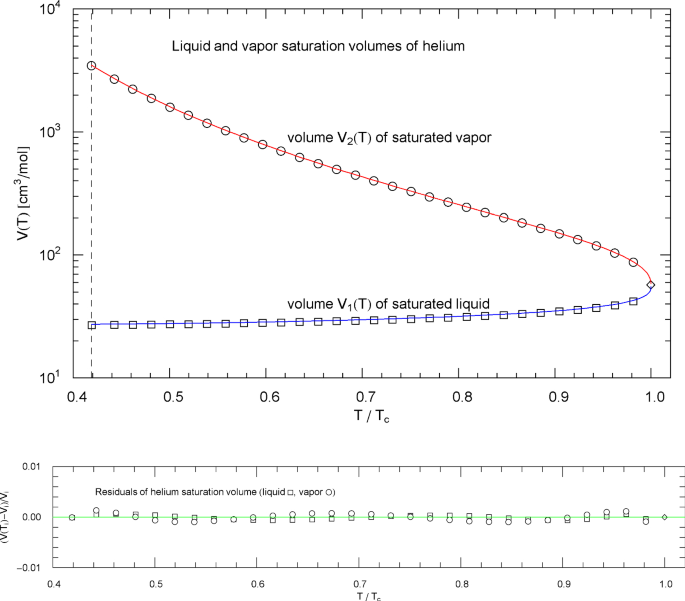
Liquid and vapor saturation volumes of normal fluid helium, cf. Section 4.3. Data points from Ref. [26]. Depicted are the liquid saturation volume in (4.6) with parameters in Table 9 (blue curve) and the vapor saturation volume in (4.7) with parameters in Table 10 (red curve). The temperature range covers the subcritical interval from the lambda point at 2.17 K (vertical dashed line) to the critical temperature at 5.195 K, cf. Table 1. The diamond indicates the critical point . Residuals of the regressed liquid and vapor saturation volumes are shown in the lower panel
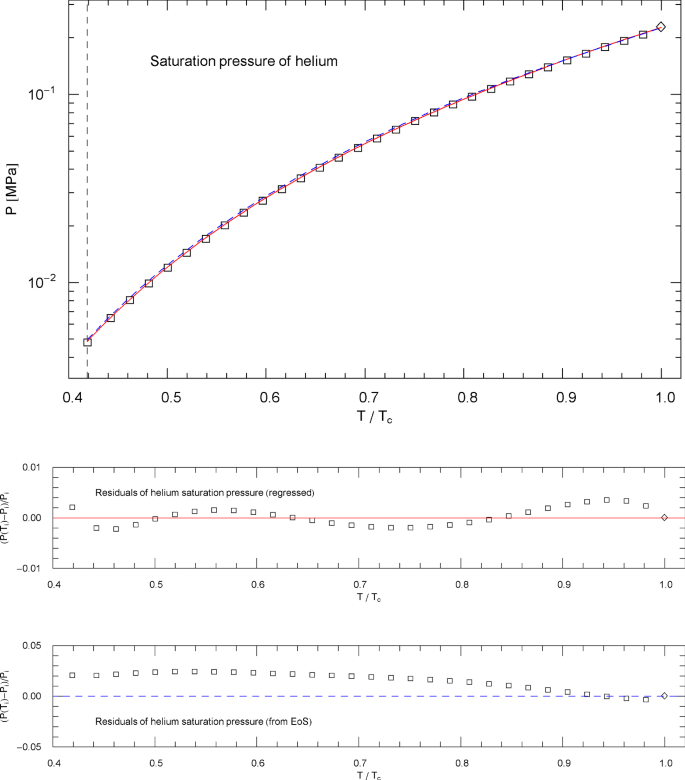
Saturation pressure of helium. Data points from Ref. [26]. Depicted is the regressed saturation pressure in (4.8) with parameters in Table 11 (solid red curve). The vertical dashed line indicates the lambda point of 2.17 K, and the diamond depicts the critical point , cf. Table 1. The blue dashed curve shows the saturation pressure calculated via EoS (2.1), (2.2) (with subcritical scale factors , in (5.7)), where is the liquid saturation density, cf. Sects. 4.2, 4.3 and Fig. 23. and very nearly coincide, which is a consistency check of the subcritical EoS, cf. Section 5. Residuals of the regressed and calculated (from EoS) saturation pressure are shown in the lower panels
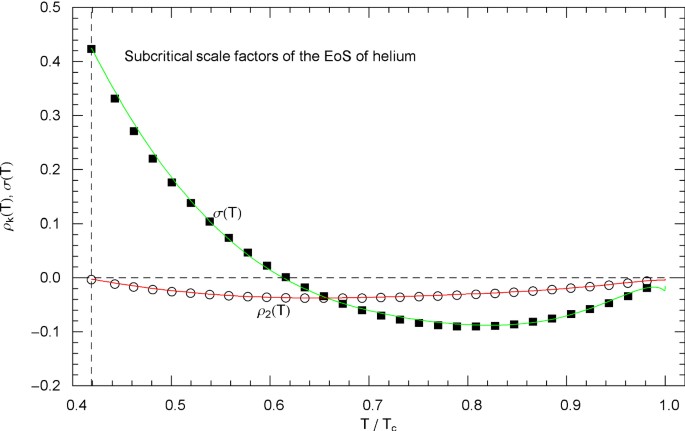
Subcritical scale factors of the EoS of normal fluid helium. The red and green curves show the scale factors and of EoS (2.1), (2.2) in the subcritical interval, cf. (5.7). The scale factors and of the subcritical EoS have been put to zero. The vertical dashed line indicates the lambda point. The depicted data points were obtained from empirical saturation data in Fig. 23 by making use of the double-tangent construction to the free energy, cf. Sects. 4.2 and 5
Common tangent construction to the free energy of nitrogen at 70 K. Panel (a) of this figure is a zoom-in of panel (b). Depicted is a plot of the free energy in (4.1), (4.2) (red curve) and the double tangent (blue line) to at the liquid and vapor saturation volumes and , cf. Section 4.2. The tangent points are indicated as diamonds. In panel (b), the tangent point at the liquid saturation volume is still partially visible on the left edge of the figure. One of the zeros of the free energy is marked by a square to facilitate linking the two panels. Linear coordinates are used, even though and differ by three orders, to make the convexity of the subcritical apparent, once the double-tangent construction is performed
The Gibbs potential in density representation reads , with EoS (2.1) and Helmholtz free energy (4.1) substituted, so that the equations of the common tangent construction in density representation read
with the liquid and vapor saturation densities and substituted. In Sect. 4.3, closed-form expressions for and will be regressed from saturation data of nitrogen, methane, carbon dioxide, methanol and helium.
Saturation Curves of Nitrogen, Methane, Carbon Dioxide, Methanol, and Helium
An analytic representation of the liquid saturation volume , cf. Section 4.2, is obtained by performing least-squares fits to saturation data in the subcritical interval , using the shifted broken power-law distribution [9, 36]
The fitting parameters in (4.6) are the positive amplitudes , , the real exponent and the positive exponents , and , . The critical volume is listed in Table 1 for the respective fluids.The liquid saturation density is the reciprocal saturation volume, .
Analogously, an analytic representation of the vapor saturation volume and density is regressed by means of the broken power law
in the temperature interval , with positive amplitudes , , real exponent and positive exponents , , . (In the case of helium, is replaced by the lambda point.)
Plots of the liquid and vapor saturation volumes and of nitrogen, methane, carbon dioxide, methanol and helium are depicted in Figs. 3, 8, 13, 18 and 23, respectively, including residual plots. The regression is based on data sets from Ref. [26]. The multiparameter reference EoS used to generate the data points (in Ref. [26]) of the nitrogen saturation curve (and the data sets of the pressure isotherms in Sect. 3) is discussed in Refs. [16, 17]; the reference EoS of methane can be found in Ref. [19], of carbon dioxide in Ref. [20] and helium in Ref. [44]. The methanol data sets in Ref. [26] are based on data tables in Ref. [43].
The fitting parameters of the liquid saturation volume in (4.6) are listed in Table 9, and the parameters of the vapor saturation volume in (4.7) are recorded in Table 10. The broken power-laws (4.6) and (4.7) have also been used for the saturation densities of pure water and hydrogen [9].
The empirical saturation pressure (cf. the end of Sect. 4.2) in the subcritical interval is modeled with the broken power law
The fitting parameters in this case are the positive amplitudes , , the real exponent and the positive exponents , . The least-squares fits and residual plots of the saturation pressure (4.8) of nitrogen, methane, carbon dioxide, methanol and helium are shown in Figs. 4, 9, 14, 19 and 24, respectively. The data sets depicted in these figures are from Ref. [26], based on multiparameter reference equations quoted above, and the regressed parameters of are recorded in Table 11.
Implementation of the Empirical Saturation Curve in the Subcritical EoS
The EoS (2.1), (2.2) and the Helmholtz free energy (4.1) are structured as
The density-dependent coefficient functions in (5.1) can be read off from EoS (2.1), (2.2),
with and regressed parameters and , obtained from a fit of the critical isotherm, cf. Section 3.1; the constants , , are defined in Sect. 2. The coefficient functions of the Helmholtz free energy (5.2) read
where and denote integrals enumerated in Sect. 4.1.
The Gibbs free energy in (4.5) can accordingly be assembled as
with density-dependent coefficients
In Eqs. (4.5) of the double-tangent construction, we substitute the decompositions (5.1) and (5.5) of and . This gives two equations linear in the four scale factors , of the EoS (2.1), (2.2). In the subcritical regime , it suffices to put and solve the resulting linear two-by-two system (4.5) for and . The explicit solution thereof reads
where we use the shortcuts
and
It remains to substitute the regressed analytic representations (4.6) and (4.7) of the liquid and vapor saturation densities and into (5.8) and (5.9). In this way, analytic closed-form scale factors , are obtained, valid in the subcritical interval . (In the case of helium, is replaced by the lambda point.) The subcritical EoS in (2.1), (2.2) is thus completely specified by substituting the scale factors and as stated in (5.7) and putting the two remaining scale factors and to zero.
The subcritical scale factors and of nitrogen, methane, carbon dioxide, methanol and helium are plotted in Figs. 5, 10, 15, 20 and 25, respectively, as red and green solid curves calculated via (5.7). The data points and indicated in these figures are also obtained from (5.7), but in this case substituting the data sets and of the liquid and vapor saturation densities into (5.8) and (5.9) instead of the regressed analytic functions and . (These data sets and the regressed saturation volumes are depicted in Figs. 3, 8, 13, 18 and 23 for the respective fluids, cf. Section 4.3.)
In Figs. 1, 6, 11, 16 and 21, the data points of the liquid branches of the subcritical isotherms (at temperatures close to the melting point) are nearly vertically stacked, which has implications for error propagation. If the density is changed by a small measurement error, , the resulting relative error of is . (We keep fixed and drop the temperature variable in , which is defined by EoS (2.1), (2.2) with scale factors (5.7).) Dividing this by the relative error gives . This quotient of the relative errors of and is independent of and can be written as derivative , which is just the slope of the isotherms in log–log representation as depicted in Figs. 1, 6, 11, 16 and 21; see also Ref. [36]. The log–log slopes of the liquid branches of the subcritical isotherms in these figures are very steep, especially close to the saturation curve from where they emanate. Accordingly, the quotient of the relative errors of and in this region is also large. Not only is rapidly varying in the vicinity of the liquid saturation density at temperatures close to the melting point but also its log–log derivative. Therefore, we refrain from indicating residuals for the depicted subcritical isotherms in Figs. 1, 6, 11, 16 and 21.
In Eqs. (4.5) of the common tangent construction, it is possible to replace the first equation by and , in this way also implementing the empirical saturation pressure in analytic form (4.8) (with parameters in Table 11). We can then put the scale factor in (5.1) and (5.5) to zero and solve the resulting linear three-by-three system for the scale factors , and . However, this three-by-three system tends to be ill-conditioned, since solution (5.7) of the two Eqs. (4.5) already accurately reproduces the empirical saturation pressure.
In fact, the regressed saturation pressure in (4.8) should coincide with and , where is the EoS (2.1), (2.2) (with subcritical scale factors specified in (5.7)) and , are the regressed liquid and vapor saturation densities in (4.6) and (4.7). is identical with , cf. (4.5), and is depicted in Figs. 4, 9, 14, 19 and 24 as blue dashed curve, closely approximating the empirical in (4.8) (red solid curve in these figures). The subcritical EoS defined in (2.1), (2.2) and (5.7) is thus consistent with the empirical saturation curve and the common tangent construction to the Helmholtz free energy, cf. Sects. 4.1 and 4.2.
Conclusion
The purpose of this paper is to demonstrate the wide applicability of EoS (2.1), (2.2), by discussing the phase equilibria and high-pressure isotherms of specific fluids such as nitrogen, methane, carbon dioxide, methanol and helium. The critical-point parameters and melting temperatures of these fluids vary over a wide range, cf. Table 1. In each case, the EoS covers the temperature range above the melting point (or lambda point in the case of normal fluid helium) and densities up to the pressure singularity. In particular, the temperature-dependent scale factors of the EoS have been determined in each case, which define the temperature evolution as analytic functions in the super- and subcritical temperature ranges. The EoS (2.1) (2.2) is of closed form, it does not involve perturbative expansions such as ascending series around the critical point often invoked in the case of cubic equations, cf. e.g. Refs. [1, 30,31,32,33,34], or virial expansions in the case of atomistic interaction models, or PC-SAFT expansions [12,13,14,15], or perturbative corrections to a free (i.e. non-interacting) molecular gas model as in the case of multiparameter EoSs [16,17,18,19,20,21,22,23,24,25, 40,41,42].
The EoS (2.1), (2.2) depends on five temperature-independent constants, regressed from the empirical critical isotherm, and also on four temperature-dependent scale factors. The latter are either regressed from supercritical isotherms or, in the subcritical regime, determined from the saturation curve. Thus, the empirical input required is a data set for the pressure isotherm passing through the critical point. This determines the temperature-independent constants of the repulsive term of the EoS, cf. Section 3.1. The supercritical scale factors of the EoS are broken power laws inferred from measured supercritical isotherms, preferably spread over a wide temperature range, cf. Sects. 3.2 and 3.3. Empirical data of the liquid and vapor saturation densities are needed to find the subcritical scale factors and thus the subcritical EoS. We used synthetic data sets from Ref. [26], obtained from multiparameter reference EoSs [16, 17, 19, 20, 44], which are an efficient means to combine and interpolate data sets collected from a large number of experimental papers (quoted in the mentioned references). The drawback of using synthetic data (provided in a convenient machine-readable format in Refs. [25, 26]) is that, especially in the critical region and also at high pressure, multiparameter EoSs are usually extrapolating beyond the available experimental data range, and the analytic high-pressure and high-temperature asymptotics of EoS (2.1), (2.2) depends on the extrapolated data points used in the regression. Alternatively, in the absence of experimental high-pressure data, one can resort to data sets from molecular dynamics simulations, cf. e.g. Refs. [45,46,47,48,49].
In Sects. 4 and 5, we explained the calculation of the subcritical scale factors from the empirical liquid and vapor saturation curves, based on the common tangent construction to the Helmholtz free energy, which is equivalent to the equal-area construction to subcritical isotherms. The free energy (obtained by density-integration of the EoS) becomes convex by way of the double tangent, cf. Figure 26, and Eqs. (4.5) derived from the tangent construction are exactly satisfied by the subcritical EoS. The EoS can, therefore, accurately reproduce the empirical coexistence curve, cf. Figures 1, 6, 11, 16, 21 and the liquid and vapor saturation densities, cf. Figures 3, 8, 13, 18, 23. We also note that EoS (2.1), (2.2) linearly depends on the temperature-dependent scale factors, and this linearity is retained in the Helmholtz and Gibbs free energies, cf. Section 5. Thus the Eqs. (4.5) of the common tangent construction are linear in the scale factors, admitting explicit analytic solution, cf. (5.7).
It is also evident from the subcritical pressure isotherms in Figs. 1, 6, 11, 16 and 21, that the EoS (2.1), (2.2) with scale factors (5.7) accurately reproduces the empirical isothermal data sets of the vapor and liquid phases to the left and right of the saturation curve. Especially the very steep liquid high-pressure isotherms closely match the data sets, in contrast to the cubic Peng-Robinson isotherms, which are also depicted in these figures for comparison.
References
J.S. Lopez-Echeverry, S. Reif-Acherman, E. Araujo-Lopez, Fluid Phase Equil. 447, 39 (2017)
G.M. Kontogeorgis, R. Privat, J.-N. Jaubert, J. Chem. Eng. Data 64, 4619 (2019)
R. Ravetti Duran, P. Escudero Falsetti, L. Muhr, R. Privat, D. Barth, J. Supercrit. Fluids 138, 17 (2018)
A. Hernández, Int. J. Thermophys. 41, 125 (2020)
M. Mashayekhi, H. Sakhaeinia, M. Shokouhi, Int. J. Thermophys. 41, 11 (2020)
A. Piña-Martinez, R. Privat, S. Lasala, G. Soave, J.-N. Jaubert, Fluid Phase Equilib. 522, 112750 (2020)
A. Hernández, R. Tahery, Int. J. Thermophys. 42, 67 (2021)
A. Hernández, Int. J. Thermophys. 42, 13 (2021)
R. Tomaschitz, J. Supercrit. Fluids 181, 105491 (2022)
R. Feistel, J.W. Lovell-Smith, O. Hellmuth, Int. J. Thermophys. 36, 44 (2015)
A.H. Harvey, Int. J. Thermophys. 40, 98 (2019)
I. Polishuk, A. Mulero, Rev. Chem. Eng. 27, 241 (2011)
Y. Khoshnamvand, M. Assareh, Int. J. Thermophys. 39, 54 (2018)
B.S. Shin, W.G. Rho, S.-S. You, J.W. Kang, C.S. Lee, Int. J. Thermophys. 39, 44 (2018)
P. Aursand, M. Gjennestad, E. Aursand, M. Hammer, Ø. Wilhelmsen, Fluid Phase Equilib. 436, 98 (2017)
R. Span, E.W. Lemmon, R.T. Jacobsen, W. Wagner, Int. J. Thermophys. 19, 1121 (1998)
R. Span, E.W. Lemmon, R.T. Jacobsen, W. Wagner, A. Yokozeki, J. Phys. Chem. Ref. Data 29, 1361 (2000)
D.G. Friend, J.F. Ely, H. Ingham, J. Phys. Chem. Ref. Data 18, 583 (1989)
U. Setzmann, W. Wagner, J. Phys. Chem. Ref. Data 20, 1061 (1991)
R. Span, W. Wagner, J. Phys. Chem. Ref. Data 25, 1509 (1996)
L. Sun, J.F. Ely, Fluid Phase Equilb. 222–223, 107 (2004)
E.W. Lemmon, R.T. Jacobsen, J. Phys. Chem. Ref. Data 34, 69 (2005)
M. Thol, F. Fenkl, E.W. Lemmon, Int. J. Thermophys. 43, 11 (2022)
M. Thol, M. Richter, Int. J. Thermophys. 42, 161 (2021)
E.W. Lemmon, I.H. Bell, M.L. Huber, M.O. McLinden, NIST Standard Reference Data-base 23, Reference Fluid Thermodynamic and Transport Properties-REFPROP, Version 10.0, National Institute of Standards and Technology, Gaithersburg, 2018, https://doi.org/10.18434/T4/1502528
E.W. Lemmon, M.O. McLinden, D.G. Friend, in NIST Chemistry WebBook, NIST Standard Reference Database 69 (2021), https://webbook.nist.gov/chemistry/fluid/
R. Tomaschitz, Fluid Phase Equilib. 496, 80 (2019)
N.F. Carnahan, K.E. Starling, AIChE J. 18, 1184 (1972)
H. Liu, Mol. Phys. 119, e1886364 (2021)
F. Yang, Q. Liu, Y. Duan, Z. Yang, Chem. Eng. Sci. 192, 565 (2018)
W. Zhao, L. Xia, X. Sun, S. Xiang, Int. J. Thermophys. 40, 105 (2019)
L.A. Román-Ramírez, G.A. Leeke, Int. J. Thermophys. 41, 61 (2020)
T. Yamada, H. Miyamoto, N. Sakoda, Y. Higashi, Int. J. Thermophys. 41, 167 (2020)
A. Piña-Martinez, R. Privat, J.-N. Jaubert, D.-Y. Peng, Fluid Phase Equilb. 485, 264 (2019)
R. Tomaschitz, Phys. Lett. A 393, 127185 (2021)
R. Tomaschitz, Eur. Phys. J. Plus 136, 629 (2021)
R. Tomaschitz, Acta Crystallogr. A 77, 420 (2021)
Wolfram Research, Inc., Mathematica, Version 13.0, Champaign, IL, 2021, https://www.wolfram.com/mathematica/
NIST Digital Library of Mathematical Functions, Release 1.1.3, F.W.J. Olver, A.B. Olde Daalhuis, D.W. Lozier, B.I. Schneider, R.F. Boisvert, C.W. Clark, B.R. Miller, B.V. Saunders, H.S. Cohl, M.A. McClain, eds., 2021, https://dlmf.nist.gov/
B.A. Younglove, J. Phys. Chem. Ref. Data 11 (Suppl. 1), 1 (1982)
B.A. Younglove, J.F. Ely, J. Phys. Chem. Ref. Data 16, 577 (1987)
B. Semrau, S. Hielscher, M. Thol, R. Span, Int. J. Thermophys. 43, 43 (2022)
K.M. de Reuck, R.J.B. Craven, Methanol, International Thermodynamic Tables of the Fluid State - 12, IUPAC (Blackwell, London, 1993)
D.O. Ortiz-Vega, K.R. Hall, J.C. Holste, V.D. Arp, A.H. Harvey, E.W. Lemmon, 2018, see Ref. [25]
Z. Duan, Z. Zhang, Geochim. Cosmochim. Acta 70, 2311 (2006)
S. Krukowski, P. Strąk, J. Chem. Phys. 124, 134501 (2006)
A. Köster, M. Thol, J. Vrabec, J. Chem. Eng. Data 63, 305 (2018)
S. Stephan, M. Thol, J. Vrabec, H. Hasse, J. Chem. Inf. Model. 59, 4248 (2019)
S. Jiang, T. Guo, Y.-X. Yu, J. Hu, Int. J. Thermophys. 43, 22 (2022)
Acknowledgements
My thanks to three anonymous referees for their suggestions and useful comments, which have greatly helped to improve an earlier draft of this paper.
Author information
Authors and Affiliations
Corresponding author
Additional information
Publisher's Note
Springer Nature remains neutral with regard to jurisdictional claims in published maps and institutional affiliations.
Rights and permissions
About this article
Cite this article
Tomaschitz, R. Phenomenological High-Pressure Equation of State for Nitrogen, Methane, Methanol, Carbon Dioxide, and Helium. Int J Thermophys 43, 130 (2022). https://doi.org/10.1007/s10765-022-03034-9
Received:
Accepted:
Published:
DOI: https://doi.org/10.1007/s10765-022-03034-9
Keywords
- Convexity of the Helmholtz free energy
- Double-tangent construction to the free energy
- Saturation pressure
- Supercritical, critical and subcritical pressure isotherms
- Non-cubic fluid equation of state
- Vapor–liquid phase equilibrium

